JVC 2003 Annual Report Download - page 36
Download and view the complete annual report
Please find page 36 of the 2003 JVC annual report below. You can navigate through the pages in the report by either clicking on the pages listed below, or by using the keyword search tool below to find specific information within the annual report.-
 1
1 -
2
-
3
-
4
-
5
-
6
-
7
-
8
-
9
-
10
-
11
-
12
-
13
-
14
-
15
-
16
-
17
-
18
-
19
-
20
-
21
-
22
-
23
-
24
-
25
-
 26
26 -
 27
27 -
 28
28 -
 29
29 -
 30
30 -
 31
31 -
 32
32 -
 33
33 -
 34
34 -
 35
35 -
 36
36 -
 37
37 -
 38
38 -
 39
39 -
 40
40 -
 41
41 -
 42
42 -
 43
43 -
 44
44 -
 45
45 -
 46
46 -
47
-
48
-
49
-
50
-
51
-
52
-
53
-
54
-
55
-
56
-
57
-
58
 |
 |

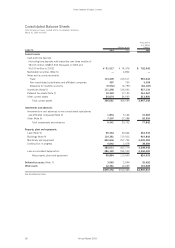
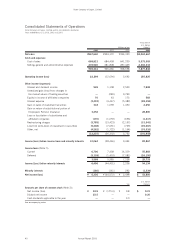
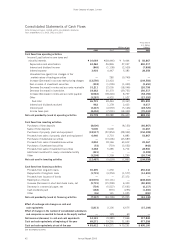
Victor Company of Japan, Limited
34 Annual Report 2003
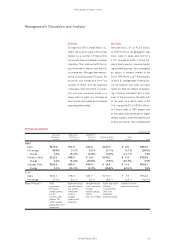
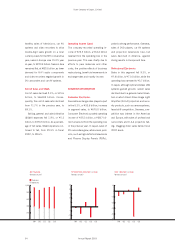
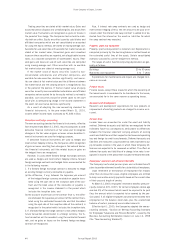
NET SALES
(Billions of yen)
0
200
400
800
1,000
600
99 0300 01 02
OPERATING INCOME (LOSS)
(Billions of yen)
Overseas
Domestic
–10
15
0
5
25
10
20
–5
–15
99 0300 01 02
NET INCOME (LOSS)
(Billions of yen)
0
10
–20
–10
–40
–50
–30
99 0300 01 02
Operating Income (Loss)
The company recorded operating in-
come of ¥22.3 billion, a ¥34.4 billion
reversal from the operating loss in the
previous year. This was chiefly due to
efforts to pare materials and other
costs, the positive effects of business
restructuring, beneficial movements in
exchange rates and royalty income.
SEGMENT INFORMATION
Consumer Electronics
Favorable exchange rates played a part
in the 5.3%, or ¥33.6 billion, increase
in segment sales, to ¥675.0 billion.
Consumer Electronics posted operating
income of ¥25.3 billion, a ¥28.7 bil-
lion turnaround from the operating loss
in the previous year. In Japan, sales of
DV camcorders grew, while visual prod-
ucts, such as high-definition televisions
and Plasma Display Panels (PDPs),
posted a strong performance. Overseas,
sales of DVD players, car AV systems
and projection televisions rose, but
sales declined in America, against
strong results in Europe and Asia.
Professional Electronics
Sales in this segment fell 9.3%, or
¥7.4 billion, to ¥71.0 billion, while the
operating loss narrowed to ¥3.7 billion.
In Japan, although optical wireless LAN
systems gained ground, overall sales
declined due to a general market down-
turn in which Direct-Drive Image Light
Amplifier (D-ILA) projectors and secu-
rity products, such as camera systems,
faced stiff competition. Overseas, com-
petition was intense in the Americas
and Europe, with sales of professional
camcorders and D-ILA projectors fall-
ing, dragging down sales below fiscal
2002 levels.
healthy sales of televisions, car AV
systems and video recorders to drive
double-digit sales growth on a local
currency-basis for the fifth consecutive
year; sales in Europe rose 15.0% year
on year, to ¥220.4 billion. Sales in Asia
remained flat, at ¥82.5 billion, as lower
demand for Hi-Fi audio components
and video recorders negated growth in
DV camcorders and car AV systems.
Cost of Sales and SG&A
Cost of sales declined 2.3%, or ¥15.6
billion, to ¥668.8 billion. Conse-
quently, the cost of sales ratio declined
from 71.7% in the previous year, to
69.1%.
Selling, general and administrative
(SG&A) expenses fell 1.9%, or ¥5.3
billion, to ¥276.5 billion. As a percent-
age of net sales, SG&A expenses con-
tinued to fall, from 29.5% in fiscal
2002, to 28.6%.