JVC 2003 Annual Report Download - page 44
Download and view the complete annual report
Please find page 44 of the 2003 JVC annual report below. You can navigate through the pages in the report by either clicking on the pages listed below, or by using the keyword search tool below to find specific information within the annual report.-
 1
1 -
2
-
3
-
4
-
5
-
6
-
7
-
8
-
9
-
10
-
11
-
12
-
13
-
14
-
15
-
16
-
17
-
18
-
19
-
20
-
21
-
22
-
23
-
24
-
25
-
26
-
27
-
28
-
29
-
30
-
31
-
32
-
33
-
 34
34 -
 35
35 -
 36
36 -
 37
37 -
 38
38 -
 39
39 -
 40
40 -
 41
41 -
 42
42 -
 43
43 -
 44
44 -
 45
45 -
 46
46 -
 47
47 -
 48
48 -
 49
49 -
 50
50 -
 51
51 -
 52
52 -
 53
53 -
 54
54 -
55
-
56
-
57
-
58
 |
 |

Victor Company of Japan, Limited
42 Annual Report 2003
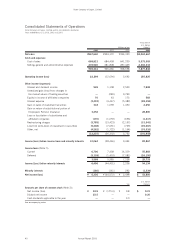
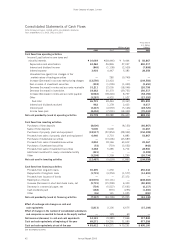
Consolidated Statements of Cash Flows
Victor Company of Japan, Limited and its consolidated subsidiaries
Years ended March 31, 2003, 2002 and 2001
Thousands of
U.S. dollars
Millions of yen (Note 1)
2003 2002 2001 2003
Cash flows from operating activities:
Income (Loss) before income taxes and
minority interests ¥ 10,064 ¥(38,446) ¥ 9,444 $ 83,867
Depreciation and amortization 24,062 26,826 27,047 200,517
Interest and dividend income (949) (1,108) (2,509) (7,908)
Interest expense 3,403 4,447 5,383 28,358
Unrealized loss (gain) from changes in fair
market values of trading securities —280 (9,749) —
Increase (Decrease) in accrued restructuring charges (12,550) 13,423 — (104,583)
Gain on sales of investment securities (318) (1,099) (1,450) (2,650)
Decrease (Increase) in notes and accounts receivable 15,211 12,055 (18,046) 126,758
Decrease (Increase) in inventories 18,062 35,370 (29,751) 150,517
Increase (Decrease) in notes and accounts payable (6,983) (18,224) 8,737 (58,192)
Other (3,287) 4,920 1,527 (27,392)
Sub-total 46,715 38,444 (9,367) 389,292
Interest and dividends received 962 1,178 2,433 8,017
Interest paid (3,447) (4,539) (5,143) (28,725)
Income taxes paid (8,452) (7,001) (14,330) (70,434)
Net cash provided by (used in) operating activities 35,778 28,082 (26,407) 298,150
Cash flows from investing activities:
Purchases of time deposits (8,000) —(8,150) (66,667)
Sales of time deposits 5,000 3,000 — 41,667
Purchases of property, plant and equipment (18,517) (22,853) (28,942) (154,308)
Proceeds from sales of property, plant and equipment 6,440 2,710 4,883 53,667
Purchases of marketable securities —(13,006) (43,687) —
Proceeds from sales of marketable securities 2,804 18,166 63,612 23,367
Purchases of investment securities (53) (719) (3,552) (442)
Proceeds from sales of investment securities 3,468 5,285 6,714 28,900
Additional investment in newly consolidated entity (421) ——(3,508)
Other (3,208) 1,799 1,255 (26,734)
Net cash used in investing activities (12,487) (5,618) (7,867) (104,058)
Cash flows from financing activities:
Proceeds from long-term loans 30,005 1,230 1 250,042
Repayments of long-term loans (1,715) (4,254) (1,577) (14,292)
Proceeds from issuance of bonds ——37,372 —
Redemption of bonds (24,970) (10,101) — (208,083)
Increase (Decrease) in short-term bank loans, net (9,719) (15,208) 6,300 (80,992)
Decrease in commercial paper, net (734) (5,527) (7,661) (6,117)
Cash dividends paid (168) (970) (255) (1,400)
Other (36) 121 1,025 (300)
Net cash provided by (used in) financing activities (7,337) (34,709) 35,205 (61,142)
Effect of exchange rate changes on cash and
cash equivalents (1,813) 2,136 6,675 (15,108)
Effect of changes in the number of consolidated subsidiaries
and companies accounted for based on the equity method — 129 60 —
Net increase (decrease) in cash and cash equivalents 14,141 (9,980) 7,666 117,842
Cash and cash equivalents at beginning of the year 69,271 79,251 71,585 577,258
Cash and cash equivalents at end of the year ¥ 83,412 ¥ 69,271 ¥ 79,251 $ 695,100
See accompanying notes.