JVC 2003 Annual Report Download - page 38
Download and view the complete annual report
Please find page 38 of the 2003 JVC annual report below. You can navigate through the pages in the report by either clicking on the pages listed below, or by using the keyword search tool below to find specific information within the annual report.-
 1
1 -
2
-
3
-
4
-
5
-
6
-
7
-
8
-
9
-
10
-
11
-
12
-
13
-
14
-
15
-
16
-
17
-
18
-
19
-
20
-
21
-
22
-
23
-
24
-
25
-
26
-
27
-
 28
28 -
 29
29 -
 30
30 -
 31
31 -
 32
32 -
 33
33 -
 34
34 -
 35
35 -
 36
36 -
 37
37 -
 38
38 -
 39
39 -
 40
40 -
 41
41 -
 42
42 -
 43
43 -
 44
44 -
 45
45 -
 46
46 -
 47
47 -
 48
48 -
49
-
50
-
51
-
52
-
53
-
54
-
55
-
56
-
57
-
58
 |
 |

Victor Company of Japan, Limited
36 Annual Report 2003
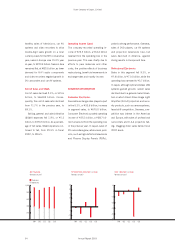
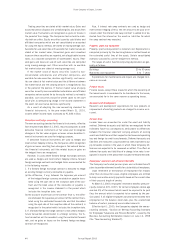
STOCKHOLDERS’ EQUITY/
TOTAL ASSETS
(Billions of yen)
0
200
300
500
600
100
400
99 0300 01 02
Stockholders’ equity
Total assets
DEPRECIATION & AMORTIZATION/
CAPITAL EXPENDITURES
(Billions of yen)
Depreciation & Amortization
Capital Expenditures
0
10
20
30
40
99 0300 01 02
R&D EXPENDITURES
(Billions of yen)
0
10
20
30
50
40
99 0300 01 02
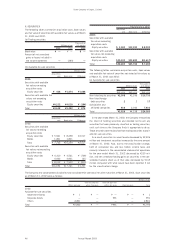
Property, plant and equipment
(less accumulated depreciation) at
the end of the fiscal year was 10.6%,
or ¥11.8 billion, lower than the pre-
vious fiscal year-end, at ¥98.9 bil-
lion. This was chiefly attributable to
lower capital expenditures and the
sale of fixed assets.
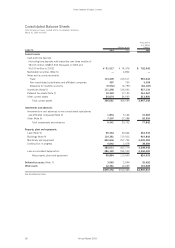
Total current liabilities fell 16.5%,
or ¥40.7 billion, to ¥206.9 billion,
reflecting the redemption of bonds due
within one year, a decline in short-term
debt and a decrease in reserves for
business restructuring.
Total long-term liabilities increased
6.6%, or ¥7.6 billion, to ¥122.3 bil-
lion, mainly due to a rise in long-term
debt.
Stockholders’ equity was up 0.1%,
or ¥0.2 billion, to ¥146.4 billion.
Stockholders’ equity as a percentage
of total assets increased to 30.5%,
compared with 28.5% at the previous
fiscal year-end.
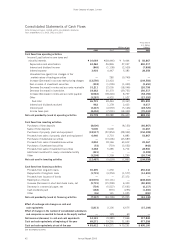
Cash Flows
Operating activities provided net cash
of ¥35.8 billion, reflecting the reduc-
tion of inventories and improvements
in working capital, and other factors
that generated funds.
Net cash used by investing activi-
ties rose ¥6.9 billion, to ¥12.5 billion.
This increase was mainly attributable
to payments of ¥18.5 billion for the
acquisition of property, plant and
equipment, which outweighed cash
inflows of ¥6.4 billion from the sale of
fixed assets.
Financing activities used net cash
of ¥7.3 billion, primarily for the re-
demption of bonds. This led to a re-
duction in interest-bearing debt of
¥10.3 billion.
As a result of the foregoing, cash and
cash equivalents at the end of the year
stood at ¥83.4 billion, 20.4%, or
¥14.1 billion, higher than a year ago.
LIQUIDITY AND SOURCES OF
FUNDS
Assets, Liabilities and Capital
Total assets as of March 31, 2003
stood at ¥479.7 billion, a 6.5%, or
¥33.6 billion decline from a year ago.
This was mainly the result of steps to
pare back total assets by reducing in-
ventories and improve working capital.
Total current assets fell 2.9%, or ¥10.5
billion, to ¥356.1 billion, mainly re-
flecting an 11.7%, or ¥14.8 billion,
reduction in inventories at the end of
the period, to ¥111.3 billion.
Investments and advances fell
55.0%, or ¥11.4 billion, to ¥9.3 bil-
lion, primarily reflecting the sale and
write down of investment securities.