Hyundai 2015 Annual Report Download - page 81
Download and view the complete annual report
Please find page 81 of the 2015 Hyundai annual report below. You can navigate through the pages in the report by either clicking on the pages listed below, or by using the keyword search tool below to find specific information within the annual report.-
 1
1 -
2
-
3
-
4
-
5
-
6
-
7
-
8
-
9
-
10
-
11
-
12
-
13
-
14
-
15
-
16
-
17
-
18
-
19
-
20
-
21
-
22
-
23
-
24
-
25
-
26
-
27
-
28
-
29
-
30
-
31
-
32
-
33
-
34
-
35
-
36
-
37
-
38
-
39
-
40
-
41
-
42
-
43
-
44
-
45
-
46
-
47
-
48
-
49
-
50
-
51
-
52
-
53
-
54
-
55
-
56
-
57
-
58
-
59
-
60
-
61
-
62
-
63
-
64
-
65
-
66
-
67
-
68
-
69
-
70
-
 71
71 -
 72
72 -
 73
73 -
 74
74 -
 75
75 -
 76
76 -
 77
77 -
 78
78 -
 79
79 -
 80
80 -
 81
81 -
 82
82 -
 83
83 -
 84
84 -
 85
85 -
 86
86 -
 87
87 -
 88
88 -
 89
89 -
 90
90 -
 91
91 -
92
 |
 |

HYUNDAI MOTOR COMPANY Annual Report 2015
160 161
NOTES TO CONSOLIDATED FINANCIAL STATEMENTS
AS OF AND FOR THE YEARS ENDED DECEMBER 31, 2015 AND 2014
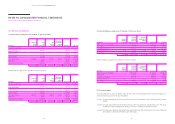
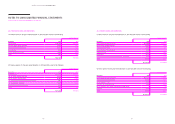
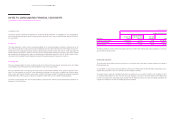
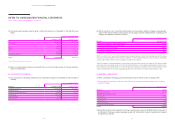
(5) The sensitivity analysis below have been determined based on reasonably possible changes of the significant as-
sumptions as of December 31, 2015 and 2014, while holding all other assumptions constant.
In millions of Korean Won
Effect on the net defined benefit liabilities
December 31, 2015 December 31, 2014
Description Increase by 1% Decrease by 1% Increase by 1% Decrease by 1%
Discount rate ₩ (462,501) ₩ 547,097 ₩ (431,595) ₩ 524,793
Rate of expected future salary increase 516,496 (445,322) 501,421 (423,593)
(6) The fair value of the plan assets as of December 31, 2015 and 2014 consists of the following:
In millions of Korean Won
Description December 31, 2015 December 31, 2014
Insurance instruments ₩ 3,616,437 ₩ 3,230,405
Debt instruments 98,586 102,734
Others 144,943 138,664
₩ 3,859,966 ₩ 3,471,803
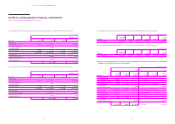
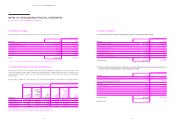
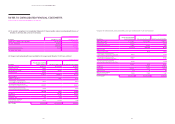
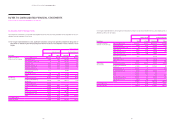
34. CASH GENERATED FROM OPERATIONS:
Cash generated from operations for the years ended December 31, 2015 and 2014 is as follows:
In millions of Korean Won
Description 2015 2014
Profit for the year ₩ 6,509,165 ₩ 7,649,468
Adjustments:
Post-employment benefits 539,936 470,016
Depreciation 1,972,727 1,843,802
Amortization of intangible assets 821,307 706,095
Provision for warranties 998,395 866,416
Income tax expense 1,950,208 2,301,806
Loss on foreign currency translation, net 109,061 242,779
Loss on disposals of PP&E, net 14,993 22,455
Interest income, net (231,666) (352,176)
Gain on share of earnings of equity-accounted investees, net (1,887,343) (2,402,979)
Gain on disposals of investments in associates, net (43,332) (13,367)
Cost of sales from financial services, net 4,841,387 4,338,252
Others 410,136 346,557
9,495,809 8,369,656
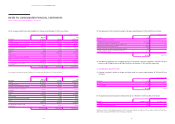
Changes in operating assets and liabilities:
Increase in trade notes and accounts receivable (801,982) (614,041)
Increase in other receivables (12,056) (213,459)
Decrease (increase) in other financial assets 217,030 (1,680,932)
Increase in inventories (1,999,181) (804,120)
Increase in other assets (295,817) (12,947)
Increase in trade notes and accounts payable 240,497 824,354
Decrease in other payables (243,701) (167,667)
Increase in other liabilities 1,806,477 227,641
Decrease in other financial liabilities (12,502) (23,610)
Changes in net defined benefit liabilities (394,928) (723,804)
Payment of severance benefits (55,954) (52,124)
Decrease in provisions (1,354,312) (1,345,291)
Changes in financial services receivables (4,292,338) (3,639,876)
Increase in operating lease assets (6,314,151) (4,267,094)
Others 15,500 71,821
(13,497,418) (12,421,149)
Cash generated from operations ₩ 2,507,556 ₩ 3,597,975