Hyundai 2015 Annual Report Download - page 67
Download and view the complete annual report
Please find page 67 of the 2015 Hyundai annual report below. You can navigate through the pages in the report by either clicking on the pages listed below, or by using the keyword search tool below to find specific information within the annual report.-
 1
1 -
2
-
3
-
4
-
5
-
6
-
7
-
8
-
9
-
10
-
11
-
12
-
13
-
14
-
15
-
16
-
17
-
18
-
19
-
20
-
21
-
22
-
23
-
24
-
25
-
26
-
27
-
28
-
29
-
30
-
31
-
32
-
33
-
34
-
35
-
36
-
37
-
38
-
39
-
40
-
41
-
42
-
43
-
44
-
45
-
46
-
47
-
48
-
49
-
50
-
51
-
52
-
53
-
54
-
55
-
56
-
 57
57 -
 58
58 -
 59
59 -
 60
60 -
 61
61 -
 62
62 -
 63
63 -
 64
64 -
 65
65 -
 66
66 -
 67
67 -
 68
68 -
 69
69 -
 70
70 -
 71
71 -
 72
72 -
 73
73 -
 74
74 -
 75
75 -
 76
76 -
 77
77 -
78
-
79
-
80
-
81
-
82
-
83
-
84
-
85
-
86
-
87
-
88
-
89
-
90
-
91
-
92
 |
 |

HYUNDAI MOTOR COMPANY Annual Report 2015
132 133
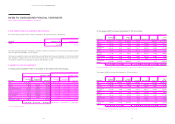
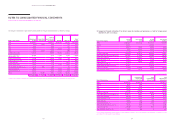
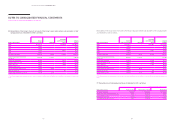
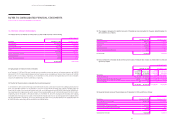
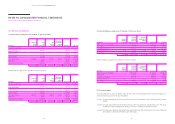
(6) Reconciliation of the Group’s share of net assets of the Group’s major joint ventures and associates to their
carrying amounts as of December 31, 2015 is as follows:
In millions of Korean Won
Name of the company
Group’s
share of net assets Goodwill
Unrealized
profit (loss) and
others
Carrying
amounts
BHMC ₩ 2,226,774 -₩ (37,453) ₩ 2,189,321
BHAF 220,475 - - 220,475
WAE 184,255 - - 184,255
HMGC 143,976 -(8,976) 135,000
CHMC 100,067 - - 100,067
Kia Motors Corporation 7,902,759 197,089 (52,300) 8,047,548
Hyundai Engineering & Construction
Co., Ltd. (*) 2,043,136 1,137,357 -3,180,493
Hyundai WIA Corporation 817,186 -(2,773) 814,413
Hyundai Powertech Co., Ltd. 434,500 -(1,412) 433,088
Hyundai Dymos Inc. 328,323 -(1,884) 326,439
Hyundai Commercial Inc. 242,507 - - 242,507
HMC Investment Securities Co., Ltd. 197,949 40,052 -238,001
Eukor Car Carriers Inc. 191,206 -262 191,468
Haevichi Hotels & Resorts Co., Ltd. (*) 106,736 3,576 -110,312
(*) The difference between the carrying amount and the fair value of the investee’s identifiable assets and liabilities as of the acquisition date is included in the amount of net
assets.
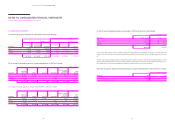
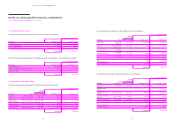
Reconciliation of the Group’s share of net assets of the Group’s major joint ventures and associates to their carrying amounts
as of December 31, 2014 is as follows:
In millions of Korean Won
Name of the company
Group’s
share of net assets Goodwill
Unrealized
profit (loss) and
others
Carrying
amounts
BHMC ₩ 2,202,923 -₩ (23,287) ₩ 2,179,636
BHAF 193,624 - - 193,624
WAE 164,090 - - 164,090
HMGC 169,048 -(10,761) 158,287
CHMC 155,573 - - 155,573
Kia Motors Corporation 7,328,393 197,089 (42,510) 7,482,972
Hyundai Engineering & Construction
Co., Ltd. (*) 1,993,529 1,137,357 -3,130,886
Hyundai WIA Corporation 710,123 -(2,410) 707,713
Hyundai Powertech Co., Ltd. 386,574 -(5,759) 380,815
Hyundai Dymos Inc. 290,812 -(1,443) 289,369
Hyundai Commercial Inc. 196,471 - - 196,471
HMC Investment Securities Co., Ltd. 185,280 40,052 -225,332
Eukor Car Carriers Inc. 169,870 -262 170,132
Hyundai HYSCO Co., Ltd. 275,529 27,172 (643) 302,058
(*) The difference between the carrying amount and the fair value of the investee’s identifiable assets and liabilities as of the acquisition date is included in the amount of net
assets.
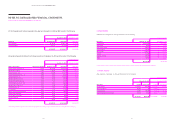
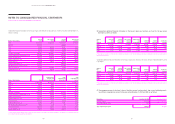
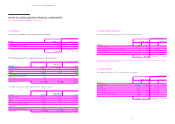
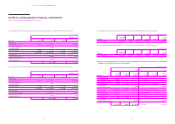
(7) The market price of listed equity securities as of December 31, 2015 is as follows:
In millions of Korean Won, except price per share
Name of the company Price per share Total number of shares Market value
Kia Motors Corporation ₩ 52,600 137,318,251 ₩ 7,222,940
Hyundai Engineering & Construction Co., Ltd. 28,550 23,327,400 665,997
Hyundai WIA Corporation 112,000 6,893,596 772,083
HMC Investment Securities Co., Ltd. 10,000 8,065,595 80,656
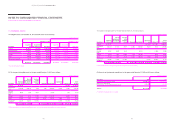
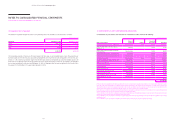
NOTES TO CONSOLIDATED FINANCIAL STATEMENTS
AS OF AND FOR THE YEARS ENDED DECEMBER 31, 2015 AND 2014