Hyundai 2015 Annual Report Download - page 63
Download and view the complete annual report
Please find page 63 of the 2015 Hyundai annual report below. You can navigate through the pages in the report by either clicking on the pages listed below, or by using the keyword search tool below to find specific information within the annual report.-
 1
1 -
2
-
3
-
4
-
5
-
6
-
7
-
8
-
9
-
10
-
11
-
12
-
13
-
14
-
15
-
16
-
17
-
18
-
19
-
20
-
21
-
22
-
23
-
24
-
25
-
26
-
27
-
28
-
29
-
30
-
31
-
32
-
33
-
34
-
35
-
36
-
37
-
38
-
39
-
40
-
41
-
42
-
43
-
44
-
45
-
46
-
47
-
48
-
49
-
50
-
51
-
52
-
 53
53 -
 54
54 -
 55
55 -
 56
56 -
 57
57 -
 58
58 -
 59
59 -
 60
60 -
 61
61 -
 62
62 -
 63
63 -
 64
64 -
 65
65 -
 66
66 -
 67
67 -
 68
68 -
 69
69 -
 70
70 -
 71
71 -
 72
72 -
 73
73 -
74
-
75
-
76
-
77
-
78
-
79
-
80
-
81
-
82
-
83
-
84
-
85
-
86
-
87
-
88
-
89
-
90
-
91
-
92
 |
 |

HYUNDAI MOTOR COMPANY Annual Report 2015
124 125
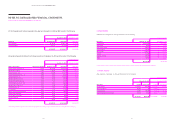
NOTES TO CONSOLIDATED FINANCIAL STATEMENTS
AS OF AND FOR THE YEARS ENDED DECEMBER 31, 2015 AND 2014
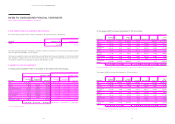
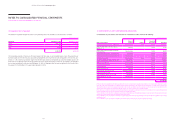
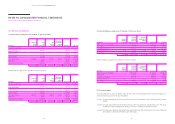
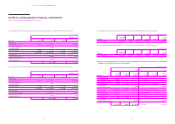
12. INVESTMENTS IN JOINT VENTURES AND ASSOCIATES:
(1) Investments in joint ventures and associates as of December 31, 2015 consist of the following:
In millions of Korean Won
Name of the company
Nature of
business Location
Ownership
Percentage Book value
Beijing-Hyundai Motor Company (BHMC) (*1) Manufacturing China 50.00% ₩ 2,189,321
Beijing Hyundai Qiche Financing Company
(BHAF) (*1, 3) Financing ˝53.00% 220,475
Hyundai WIA Automotive Engine (Shandong)
Company (WAE) Manufacturing ˝22.00% 184,255
Hyundai Motor Group China, Ltd. (HMGC) (*1) Investment ˝50.00% 135,000
Sichuan Hyundai Motor Company (CHMC) (*1) Manufacturing ˝50.00% 100,067
Kia Motors Corporation Manufacturing Korea 33.88% 8,047,548
Hyundai Engineering & Construction Co., Ltd. Construction ˝20.95% 3,180,493
Hyundai WIA Corporation Manufacturing ˝25.35% 814,413
Hyundai Powertech Co., Ltd. Manufacturing ˝37.58% 433,088
Hyundai Dymos Inc. Manufacturing ˝47.27% 326,439
Hyundai Commercial Inc. Financing ˝50.00% 242,507
HMC Investment Securities Co., Ltd. Securities brokerage ˝27.49% 238,001
Eukor Car Carriers Inc. (*2) Transportation ˝12.00% 191,468
Haevichi Hotels & Resorts Co., Ltd. (*4) Hotelkeeping ˝41.90% 110,312
Hyundai HYSCO Co., Ltd. (*5) Manufacturing ˝-
Others 496,556
₩ 16,909,943
(*1) Each of the joint arrangements in which the Group retains joint control is structured through a separate entity and there are no contractual terms stating that the parties
retain rights to the assets and obligations for the liabilities relating to the joint arrangement or other relevant facts and circumstances. As a result, the Group considers that
the parties that retain joint control in the arrangement have rights to the net assets and classifies the joint arrangements as joint ventures. Also, there are restrictions which
require consent from the director who is designated by the other investors, for certain transactions such as payment of dividend.
(*2) As the Group is considered to be able to exercise significant influence by representation on the board of directors of the investee and other reasons, although the total
ownership percentage is less than 20%, the investment is accounted for using the equity method.
(*3) As of December 31, 2015, the entity is categorized as a joint venture although the Group’s total ownership percentage is a majority share of 53%, because the Group does
not have control over the entity by virtue of an agreement with the other investors.
(*4) As of December 31, 2015, the investment is accounted for using the equity method as the ownership percentage is more than 20% due to the acquisition of shares through
a contribution in kind.
(*5) As of December 31, 2015, the investment is classified as AFS financial assets since the entity was merged into Hyundai Steel Company.
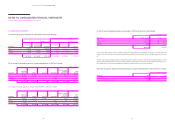
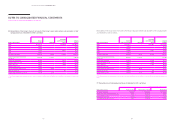
(4) Impairment test of goodwill
The allocation of goodwill amongst the Group’s cash-generating units as of December 31, 2015 and 2014 is as follows:
In millions of Korean Won
Description December 31, 2015 December 31, 2014
Vehicle ₩ 191,626 ₩ 186,026
Finance 482 482
Others 99,970 99,970
₩ 292,078 ₩ 286,478
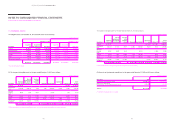
The recoverable amounts of the Group’s CGUs are measured at their value-in-use calculated based on cash flow projections of
financial budgets for the next five years approved by management and the pre-tax discount rate applied to the cash flow pro-
jections is 11.8%. Cash flow projections beyond the next five-year period are extrapolated by using the estimated growth rate
which does not exceed the long-term average growth rate of the region and industry to which the CGU belongs. No impairment
loss has been recognized for the year ended December 31, 2015. An impairment loss has been recognized for the Finance CGU in
the amount of ₩ 1,429 million for the year ended December 31, 2014.