Hyundai 2015 Annual Report Download - page 66
Download and view the complete annual report
Please find page 66 of the 2015 Hyundai annual report below. You can navigate through the pages in the report by either clicking on the pages listed below, or by using the keyword search tool below to find specific information within the annual report.-
 1
1 -
2
-
3
-
4
-
5
-
6
-
7
-
8
-
9
-
10
-
11
-
12
-
13
-
14
-
15
-
16
-
17
-
18
-
19
-
20
-
21
-
22
-
23
-
24
-
25
-
26
-
27
-
28
-
29
-
30
-
31
-
32
-
33
-
34
-
35
-
36
-
37
-
38
-
39
-
40
-
41
-
42
-
43
-
44
-
45
-
46
-
47
-
48
-
49
-
50
-
51
-
52
-
53
-
54
-
55
-
 56
56 -
 57
57 -
 58
58 -
 59
59 -
 60
60 -
 61
61 -
 62
62 -
 63
63 -
 64
64 -
 65
65 -
 66
66 -
 67
67 -
 68
68 -
 69
69 -
 70
70 -
 71
71 -
 72
72 -
 73
73 -
 74
74 -
 75
75 -
 76
76 -
77
-
78
-
79
-
80
-
81
-
82
-
83
-
84
-
85
-
86
-
87
-
88
-
89
-
90
-
91
-
92
 |
 |

HYUNDAI MOTOR COMPANY Annual Report 2015
130 131
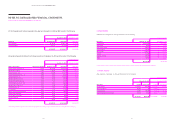
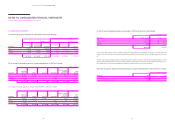
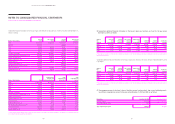
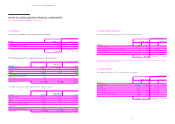
Summarized financial information of the Group’s major joint ventures and associates as of and for the year ended December 31,
2014 is as follows:
In millions of Korean Won
Name of the company
Current
assets
Non-current
assets
Current
liabilities
Non-current
liabilities
BHMC ₩ 8,017,912 ₩ 2,822,478 ₩ 6,104,511 ₩ 330,032
BHAF (*) 2,313,511 -1,948,183 -
WAE 810,860 882,572 396,641 554,056
HMGC 408,159 302,466 244,695 127,834
CHMC 474,710 575,607 239,165 500,007
Kia Motors Corporation 16,655,401 24,388,801 11,974,338 6,585,999
Hyundai Engineering & Construction Co., Ltd. 13,642,088 4,797,605 8,256,605 3,216,775
Hyundai WIA Corporation 3,452,727 2,484,590 1,830,980 1,257,464
Hyundai Powertech Co., Ltd. 815,573 1,305,272 752,801 340,814
Hyundai Dymos Inc. 1,078,838 780,341 662,110 589,631
Hyundai Commercial Inc. (*) 4,778,907 -4,284,158 -
HMC Investment Securities Co., Ltd. (*) 5,592,617 -4,918,694 -
Eukor Car Carriers Inc. 503,455 2,541,803 316,999 1,312,677
Hyundai HYSCO Co., Ltd. 1,736,275 805,183 1,032,851 576,592
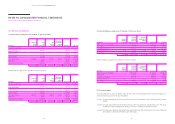
In millions of Korean Won
Name of the company Sales
Profit (loss) for
the year from
continuing operations
Other
comprehensive
Income (loss)
Total
comprehensive
income
BHMC ₩ 19,755,886 ₩ 1,925,153 -₩ 1,925,153
BHAF (*) 181,756 17,817 -17,817
WAE 1,778,572 138,819 -138,819
HMGC 1,543,128 59,947 -59,947
CHMC 362,750 (9,716) -(9,716)
Kia Motors Corporation 47,097,049 2,993,593 (416,539) 2,577,054
Hyundai Engineering & Construction Co., Ltd. 17,386,959 586,697 (23,108) 563,589
Hyundai WIA Corporation 7,595,606 439,189 6,214 445,403
Hyundai Powertech Co., Ltd. 3,253,110 103,744 104 103,848
Hyundai Dymos Inc. 2,550,730 31,068 (6,687) 24,381
Hyundai Commercial Inc. (*) 350,831 24,711 19,521 44,232
HMC Investment Securities Co., Ltd. (*) 515,456 6,610 317 6,927
Eukor Car Carriers Inc. 2,487,114 196,984 60,726 257,710
Hyundai HYSCO Co., Ltd. 4,214,317 164,826 (47,635) 117,191
(*) The companies operate financial business and their total assets (liabilities) are included in current assets (liabilities) as the companies do not distinguish current and
non-current portion in their separate financial statements.
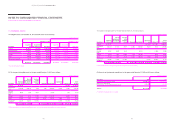
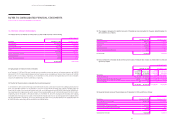
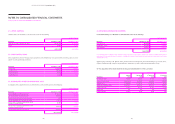
NOTES TO CONSOLIDATED FINANCIAL STATEMENTS
AS OF AND FOR THE YEARS ENDED DECEMBER 31, 2015 AND 2014
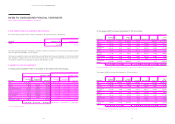
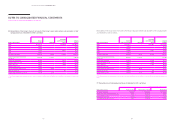
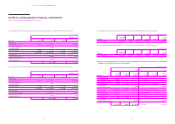
(4) Summarized additional financial information of the Group’s major joint ventures as of and for the year ended
December 31, 2015 is as follows:
In millions of Korean Won
Name of
the
company
Cash and
cash
equivalents
Current
financial
liabilities
Non-current
financial
liabilities
Depreciation
and
amortization
Interest
income
Interest
expenses
Income tax
expense
BHMC ₩ 214,036 -₩ 249,872 ₩ 326,679 ₩ 34,905 ₩ 79,078 ₩ 460,725
BHAF (*) 410,959 3,024,580 -2,382 337,084 128,132 14,626
HMGC 27,027 229,704 170,057 12,200 421 19,538 1,536
CHMC 17,231 60,431 547,763 27,459 1,483 25,241 -
(*) Operating finance business of which total assets (liabilities) are included in current financial liabilities as BHAF does not distinguish current and non-current portion in
separate financial statements.
Summarized additional financial information of the Group’s major joint ventures as of and for the year ended December 31, 2014
is as follows:
In millions of Korean Won
Name of
the
company
Cash and
cash
equivalents
Current
financial
liabilities
Non-current
financial
liabilities
Depreciation
and
amortization
Interest
income
Interest
expenses
Income tax
expense
BHMC ₩ 867,555 -₩ 247,534 ₩ 290,920 ₩ 29,076 ₩ 54,141 ₩ 641,753
BHAF (*) 279,486 1,948,183 -1,278 177,122 84,809 5,973
HMGC 44,836 49,153 127,834 4,369 1,146 6,912 16,832
CHMC 196,076 44,285 500,007 4,049 2,492 7,210 -
(*) Operating finance business of which total assets (liabilities) are included in current financial liabilities as BHAF does not distinguish current and non-current portion in
separate financial statements.
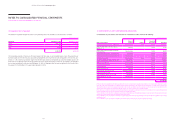
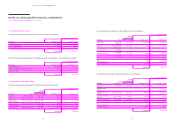
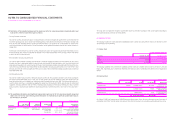
(5) The aggregate amounts of the Group’s share of the joint ventures’ and associates’, that are not individually materi-
al, profit and comprehensive income for the years ended December 31, 2015 and 2014 are as follows:
In millions of Korean Won
Description December 31, 2015 December 31, 2014
Profit for the year ₩ 76,590 ₩ 75,451
Other comprehensive income 3,967 890
Total comprehensive income ₩ 80,557 ₩ 76,341