Hyundai 2015 Annual Report Download - page 61
Download and view the complete annual report
Please find page 61 of the 2015 Hyundai annual report below. You can navigate through the pages in the report by either clicking on the pages listed below, or by using the keyword search tool below to find specific information within the annual report.-
 1
1 -
2
-
3
-
4
-
5
-
6
-
7
-
8
-
9
-
10
-
11
-
12
-
13
-
14
-
15
-
16
-
17
-
18
-
19
-
20
-
21
-
22
-
23
-
24
-
25
-
26
-
27
-
28
-
29
-
30
-
31
-
32
-
33
-
34
-
35
-
36
-
37
-
38
-
39
-
40
-
41
-
42
-
43
-
44
-
45
-
46
-
47
-
48
-
49
-
50
-
 51
51 -
 52
52 -
 53
53 -
 54
54 -
 55
55 -
 56
56 -
 57
57 -
 58
58 -
 59
59 -
 60
60 -
 61
61 -
 62
62 -
 63
63 -
 64
64 -
 65
65 -
 66
66 -
 67
67 -
 68
68 -
 69
69 -
 70
70 -
 71
71 -
72
-
73
-
74
-
75
-
76
-
77
-
78
-
79
-
80
-
81
-
82
-
83
-
84
-
85
-
86
-
87
-
88
-
89
-
90
-
91
-
92
 |
 |

HYUNDAI MOTOR COMPANY Annual Report 2015
120 121
NOTES TO CONSOLIDATED FINANCIAL STATEMENTS
AS OF AND FOR THE YEARS ENDED DECEMBER 31, 2015 AND 2014
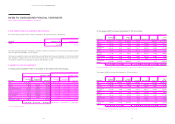
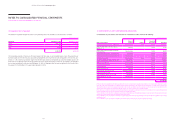
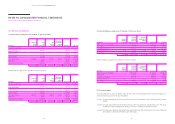
10. INVESTMENT PROPERTY:
(1) Investment property as of December 31, 2015 and 2014 consist of the following:
In millions of Korean Won
Description
December 31, 2015 December 31, 2014
Acquisition
cost
Accumulated
depreciation Book value
Acquisition
cost
Accumulated
depreciation Book value
Land ₩ 59,631 -₩ 59,631 ₩ 63,406 -₩ 63,406
Buildings 400,602 (181,769) 218,833 398,626 (153,193) 245,433
Structures 18,630 (5,670) 12,960 18,630 (5,262) 13,368
₩ 478,863 ₩ (187,439) ₩ 291,424 ₩ 480,662 ₩ (158,455) ₩ 322,207
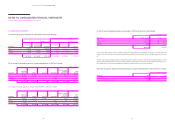
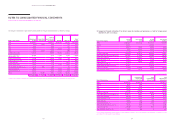
(2) The changes in investment property for the year ended December 31, 2015 are as follows:
In millions of Korean Won
Description
Beginning
of the year Transfers Disposals Depreciation
Effect of foreign
exchange
differences
End of
the year
Land ₩ 63,406 ₩ (3,886) - - ₩ 111 ₩ 59,631
Buildings 245,433 (16,275) -(12,858) 2,533 218,833
Structures 13,368 - - (408) -12,960
₩ 322,207 ₩ (20,161) -₩ (13,266) ₩ 2,644 ₩ 291,424
The changes in investment property for the year ended December 31, 2014 are as follows:
In millions of Korean Won
Description
Beginning
of the year Transfers Disposals Depreciation
Effect of foreign
exchange
differences
End of
the year
Land ₩ 62,467 ₩ 3,617 ₩ (2,836) -₩ 158 ₩ 63,406
Buildings 187,741 67,373 -(10,722) 1,041 245,433
Structures 13,776 - - (408) -13,368
₩ 263,984 ₩ 70,990 ₩ (2,836) ₩ (11,130) ₩ 1,199 ₩ 322,207
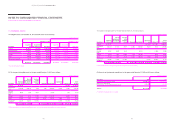
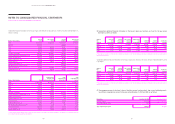
(3) The fair value of investment property as of December 31, 2015 and 2014 consist of the following:
In millions of Korean Won
Description December 31, 2015 December 31, 2014
Land ₩ 59,631 ₩ 64,783
Buildings 434,383 436,271
Structures 15,496 15,514
₩ 509,510 ₩ 516,568
The fair value measurement of the investment property was performed by an independent third party. The Group deems the
change in fair value from the fair value measurement performed at the initial recognition of the investment property is not mate-
rial.
The fair value of the investment property is classified as Level 3, based on the inputs used in the valuation techniques. The fair
value has been determined based on the cost approach and the market approach. The cost approach measured fair value as cur-
rent replacement cost considering supplementary installation, depreciation period, structure and design.
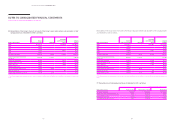
(4) Income and expenses related to investment property for the years ended December 31, 2015 and 2014 are as follows:
In millions of Korean Won
Description 2015 2014
Rental income ₩ 57,366 ₩ 42,499
Operating and maintenance expenses 14,449 19,433