Hyundai 2015 Annual Report Download - page 71
Download and view the complete annual report
Please find page 71 of the 2015 Hyundai annual report below. You can navigate through the pages in the report by either clicking on the pages listed below, or by using the keyword search tool below to find specific information within the annual report.-
 1
1 -
2
-
3
-
4
-
5
-
6
-
7
-
8
-
9
-
10
-
11
-
12
-
13
-
14
-
15
-
16
-
17
-
18
-
19
-
20
-
21
-
22
-
23
-
24
-
25
-
26
-
27
-
28
-
29
-
30
-
31
-
32
-
33
-
34
-
35
-
36
-
37
-
38
-
39
-
40
-
41
-
42
-
43
-
44
-
45
-
46
-
47
-
48
-
49
-
50
-
51
-
52
-
53
-
54
-
55
-
56
-
57
-
58
-
59
-
60
-
 61
61 -
 62
62 -
 63
63 -
 64
64 -
 65
65 -
 66
66 -
 67
67 -
 68
68 -
 69
69 -
 70
70 -
 71
71 -
 72
72 -
 73
73 -
 74
74 -
 75
75 -
 76
76 -
 77
77 -
 78
78 -
 79
79 -
 80
80 -
 81
81 -
82
-
83
-
84
-
85
-
86
-
87
-
88
-
89
-
90
-
91
-
92
 |
 |

HYUNDAI MOTOR COMPANY Annual Report 2015
140 141
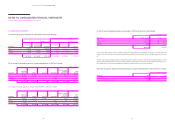
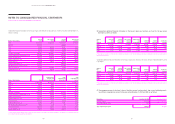
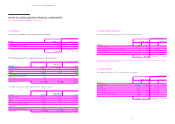
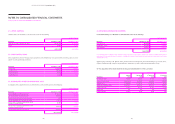
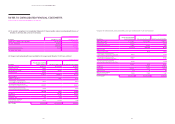
19. FINANCIAL INSTRUMENTS:
(1) Financial assets by categories as of December 31, 2015 are as follows:
In millions of Korean Won
Description
Financial
assets
at FVTPL
Loans
and
receivables
AFS
financial
assets
Derivatives
designated as
hedging
instruments Book value Fair value
Cash and cash equivalents -₩ 7,331,463 - - ₩ 7,331,463 ₩ 7,331,463
Short-term and long-term
financial instruments -6,976,462 - - 6,976,462 6,976,462
Trade notes and
accounts receivable -4,535,942 - - 4,535,942 4,535,942
Other receivables -3,172,390 - - 3,172,390 3,172,390
Other financial assets 10,135,228 177,776 2,605,817 220,824 13,139,645 13,139,645
Other assets -306,621 - - 306,621 306,621
Financial services receivables -48,336,400 - - 48,336,400 49,122,390
₩ 10,135,228 ₩ 70,837,054 ₩ 2,605,817 ₩ 220,824 ₩ 83,798,923 ₩ 84,584,913
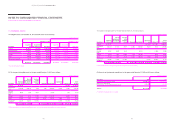
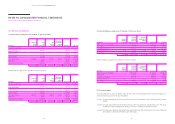
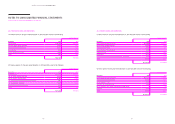
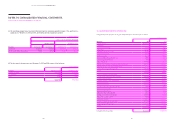
Financial assets by categories as of December 31, 2014 are as follows:
In millions of Korean Won
Description
Financial
assets
at FVTPL
Loans
and
receivables
AFS
financial
assets
Derivatives
designated as
hedging
instruments Book value Fair value
Cash and cash equivalents -₩ 7,096,513 - - ₩ 7,096,513 ₩ 7,096,513
Short-term and long-term
financial instruments -4,101,550 - - 4,101,550 4,101,550
Trade notes and
accounts receivable -3,801,626 - - 3,801,626 3,801,626
Other receivables -3,143,926 - - 3,143,926 3,143,926
Other financial assets 14,857,723 241,762 2,266,066 39,002 17,404,553 17,404,553
Other assets -434,481 - - 434,481 434,481
Financial services receivables -43,994,588 - - 43,994,588 44,292,330
₩ 14,857,723 ₩ 62,814,446 ₩ 2,266,066 ₩ 39,002 ₩ 79,977,237 ₩ 80,274,979
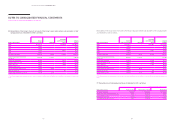
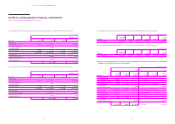
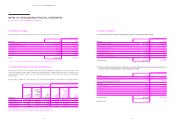
(2) Financial liabilities by categories as of December 31, 2015 are as follows:
In millions of Korean Won
Description
Financial
liabilities
at FVTPL
Financial
liabilities
carried at
amortized cost
Derivatives
designated as
hedging
instruments Book value Fair value
Trade notes and accounts payable -₩ 7,081,124 -₩ 7,081,124 ₩ 7,081,124
Other payables -4,713,548 -4,713,548 4,713,548
Borrowings and debentures -64,932,340 -64,932,340 65,419,089
Other financial liabilities 37,448 621,981 161,290 820,719 820,719
Other liabilities -3,051,512 -3,051,512 3,051,512
₩ 37,448 ₩ 80,400,505 ₩ 161,290 ₩ 80,599,243 ₩ 81,085,992
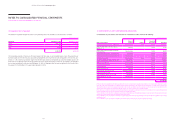
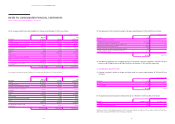
Financial liabilities by categories as of December 31, 2014 are as follows:
In millions of Korean Won
Description
Financial
liabilities
at FVTPL
Financial
liabilities
carried at
amortized cost
Derivatives
designated as
hedging
instruments Book value Fair value
Trade notes and accounts payable -₩ 7,041,529 -₩ 7,041,529 ₩ 7,041,529
Other payables -4,688,812 -4,688,812 4,688,812
Borrowings and debentures -54,257,932 -54,257,932 55,033,485
Other financial liabilities 10,331 9,471 414,029 433,831 433,831
Other liabilities -1,954,335 -1,954,335 1,954,335
₩ 10,331 ₩ 67,952,079 ₩ 414,029 ₩ 68,376,439 ₩ 69,151,992
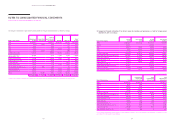
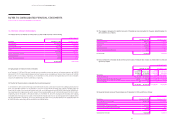
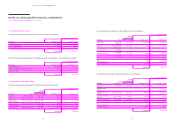
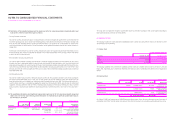
(3) Fair value estimation
The Group categorizes the assets and liabilities measured at fair value into the following three-level fair value hierarchy in ac-
cordance with the inputs used for fair value measurement.
● Level 1: Fair value measurements are those derived from quoted prices (unadjusted) in active markets for identical assets or
liabilities.
● Level 2: Fair value measurements are those derived from inputs other than quoted prices included within Level 1 that are ob-
servable for the asset or liability, either directly (i.e. as prices) or indirectly (i.e. derived from prices).
● Level 3: Fair value measurements are those derived from valuation techniques that include inputs for the asset or liability that
are not based on observable market data (unobservable inputs).
NOTES TO CONSOLIDATED FINANCIAL STATEMENTS
AS OF AND FOR THE YEARS ENDED DECEMBER 31, 2015 AND 2014