Holiday Inn 2009 Annual Report Download - page 96
Download and view the complete annual report
Please find page 96 of the 2009 Holiday Inn annual report below. You can navigate through the pages in the report by either clicking on the pages listed below, or by using the keyword search tool below to find specific information within the annual report.-
 1
1 -
2
-
3
-
4
-
5
-
6
-
7
-
8
-
9
-
10
-
11
-
12
-
13
-
14
-
15
-
16
-
17
-
18
-
19
-
20
-
21
-
22
-
23
-
24
-
25
-
26
-
27
-
28
-
29
-
30
-
31
-
32
-
33
-
34
-
35
-
36
-
37
-
38
-
39
-
40
-
41
-
42
-
43
-
44
-
45
-
46
-
47
-
48
-
49
-
50
-
51
-
52
-
53
-
54
-
55
-
56
-
57
-
58
-
59
-
60
-
61
-
62
-
63
-
64
-
65
-
66
-
67
-
68
-
69
-
70
-
71
-
72
-
73
-
74
-
75
-
76
-
77
-
78
-
79
-
80
-
81
-
82
-
83
-
84
-
85
-
 86
86 -
 87
87 -
 88
88 -
 89
89 -
 90
90 -
 91
91 -
 92
92 -
 93
93 -
 94
94 -
 95
95 -
 96
96 -
 97
97 -
 98
98 -
 99
99 -
 100
100 -
 101
101 -
 102
102 -
 103
103 -
 104
104 -
 105
105 -
 106
106 -
107
-
108
-
109
-
110
-
111
-
112
-
113
-
114
-
115
-
116
-
117
-
118
-
119
-
120
 |
 |

94 IHG Annual Report and Financial Statements 2009
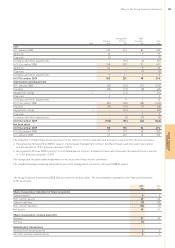
25 Retirement benefits continued
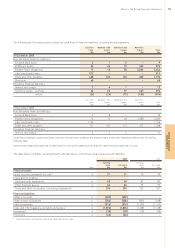
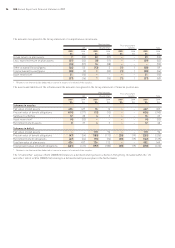
The amounts recognised in the Group statement of comprehensive income are:
Pension plans Post-employment
UK US and other benefits Total
2009 2008 2009 2008 2009 2008 2009 2008
$m $m $m $m $m $m $m $m
Actual return on plan assets 7(25) 22 (27) ––29 (52)
Less: expected return on plan assets (21) (32) (8) (11) ––(29) (43)
(14) (57) 14 (38) –––(95)
Other actuarial (losses)/gains (44) 55 (13) 3(1) 1(58) 59
Total actuarial (losses)/gains (58) (2) 1(35) (1) 1(58) (36)
Asset restriction* 21 (14) ––––21 (14)
(37) (16) 1(35) (1) 1(37) (50)
* Relates to tax that would be deducted at source in respect of a refund of the surplus.
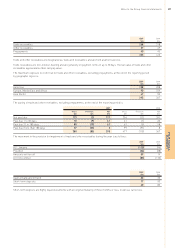
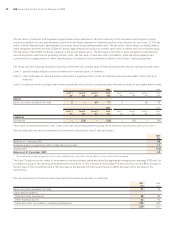
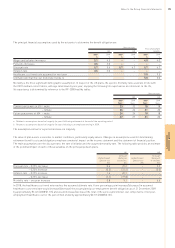
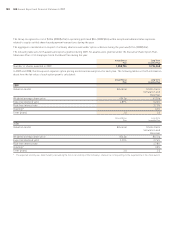
The assets and liabilities of the schemes and the amounts recognised in the Group statement of financial position are:
Pension plans Post-employment
UK US and other benefits Total
2009 2008 2009 2008 2009 2008 2009 2008
$m $m $m $m $m $m $m $m
Schemes in surplus
Fair value of plan assets 426 437 16 16 ––442 453
Present value of benefit obligations (414) (377) (12) (13) ––(426) (390)
Surplus in schemes 12 60 43––16 63
Asset restriction* (4) (23) ––––(4) (23)
Retirement benefit assets 837 43––12 40
Schemes in deficit
Fair value of plan assets ––110 96 ––110 96
Present value of benefit obligations (47) (34) (185) (172) (20) (19) (252) (225)
Retirement benefit obligations (47) (34) (75) (76) (20) (19) (142) (129)
Total fair value of plan assets 426 437 126 112 ––552 549
Total present value of benefit obligations (461) (411) (197) (185) (20) (19) (678) (615)
* Relates to tax that would be deducted at source in respect of a refund of the surplus.
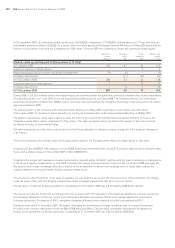
The ‘US and other’ surplus of $4m (2008 $3m) relates to a defined benefit pension scheme in Hong Kong. Included within the ‘US
and other’ deficit is $1m (2008 $1m) relating to a defined benefit pension plan in the Netherlands.
Notes to the Group financial statements continued