Holiday Inn 2009 Annual Report Download - page 76
Download and view the complete annual report
Please find page 76 of the 2009 Holiday Inn annual report below. You can navigate through the pages in the report by either clicking on the pages listed below, or by using the keyword search tool below to find specific information within the annual report.-
 1
1 -
2
-
3
-
4
-
5
-
6
-
7
-
8
-
9
-
10
-
11
-
12
-
13
-
14
-
15
-
16
-
17
-
18
-
19
-
20
-
21
-
22
-
23
-
24
-
25
-
26
-
27
-
28
-
29
-
30
-
31
-
32
-
33
-
34
-
35
-
36
-
37
-
38
-
39
-
40
-
41
-
42
-
43
-
44
-
45
-
46
-
47
-
48
-
49
-
50
-
51
-
52
-
53
-
54
-
55
-
56
-
57
-
58
-
59
-
60
-
61
-
62
-
63
-
64
-
65
-
 66
66 -
 67
67 -
 68
68 -
 69
69 -
 70
70 -
 71
71 -
 72
72 -
 73
73 -
 74
74 -
 75
75 -
 76
76 -
 77
77 -
 78
78 -
 79
79 -
 80
80 -
 81
81 -
 82
82 -
 83
83 -
 84
84 -
 85
85 -
 86
86 -
87
-
88
-
89
-
90
-
91
-
92
-
93
-
94
-
95
-
96
-
97
-
98
-
99
-
100
-
101
-
102
-
103
-
104
-
105
-
106
-
107
-
108
-
109
-
110
-
111
-
112
-
113
-
114
-
115
-
116
-
117
-
118
-
119
-
120
 |
 |

74 IHG Annual Report and Financial Statements 2009
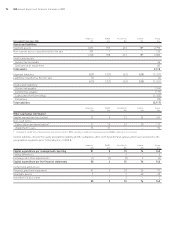
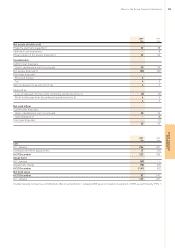
2 Segmental information continued
Americas EMEA Asia Pacific Central Group
Year ended 31 December 2008 $m $m $m $m $m
Assets and liabilities
Segment assets 1,031 957 613 189 2,790
Non-current assets classified as held for sale 2091––210
1,240 958 613 189 3,000
Unallocated assets:
Current tax receivable 36
Cash and cash equivalents 82
Total assets 3,118
Segment liabilities (429) (257) (63) (508) (1,257)
Liabilities classified as held for sale (4) – – – (4)
(433) (257) (63) (508) (1,261)
Unallocated liabilities:
Current tax payable (374)
Deferred tax payable (117)
Loans and other borrowings (1,355)
Derivatives (10)
Total liabilities (3,117)
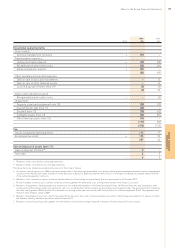
Americas EMEA Asia Pacific Central Group
$m $m $m $m $m
Other segmental information
Capital expenditure (see below) 51 5 13 74 143
Non-cash items:
Depreciation and amortisation* 31 35 26 20 112
Impairment losses 75 21 – – 96
* Included in the $112m of depreciation and amortisation is $32m relating to administrative expenses and $80m relating to cost of sales.
Central liabilities include the loyalty programme liability and the cumulative short-term System Fund surplus which were allocated to the
geographical segments prior to the adoption of IFRS 8.
Americas EMEA Asia Pacific Central Group
Reconciliation of capital expenditure $m $m $m $m $m
Capital expenditure per management reporting 51 5 13 74 143
Timing differences ––4–4
Exchange and other adjustments (1) (3) (2) 2 (4)
Capital expenditure per the financial statements 50 2 15 76 143
Comprising additions to:
Property, plant and equipment 43 2 10 36 91
Intangible assets 7 – 2 40 49
Investment in associates ––3–3
50 2 15 76 143
Notes to the Group financial statements continued