Holiday Inn 2009 Annual Report Download - page 94
Download and view the complete annual report
Please find page 94 of the 2009 Holiday Inn annual report below. You can navigate through the pages in the report by either clicking on the pages listed below, or by using the keyword search tool below to find specific information within the annual report.-
 1
1 -
2
-
3
-
4
-
5
-
6
-
7
-
8
-
9
-
10
-
11
-
12
-
13
-
14
-
15
-
16
-
17
-
18
-
19
-
20
-
21
-
22
-
23
-
24
-
25
-
26
-
27
-
28
-
29
-
30
-
31
-
32
-
33
-
34
-
35
-
36
-
37
-
38
-
39
-
40
-
41
-
42
-
43
-
44
-
45
-
46
-
47
-
48
-
49
-
50
-
51
-
52
-
53
-
54
-
55
-
56
-
57
-
58
-
59
-
60
-
61
-
62
-
63
-
64
-
65
-
66
-
67
-
68
-
69
-
70
-
71
-
72
-
73
-
74
-
75
-
76
-
77
-
78
-
79
-
80
-
81
-
82
-
83
-
 84
84 -
 85
85 -
 86
86 -
 87
87 -
 88
88 -
 89
89 -
 90
90 -
 91
91 -
 92
92 -
 93
93 -
 94
94 -
 95
95 -
 96
96 -
 97
97 -
 98
98 -
 99
99 -
 100
100 -
 101
101 -
 102
102 -
 103
103 -
 104
104 -
105
-
106
-
107
-
108
-
109
-
110
-
111
-
112
-
113
-
114
-
115
-
116
-
117
-
118
-
119
-
120
 |
 |

92 IHG Annual Report and Financial Statements 2009
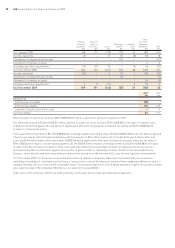
23 Financial instruments continued
The fair value of cash and cash equivalents approximates book value due to the short maturity of the investments and deposits. Equity
securities available-for-sale and derivatives are held in the Group statement of financial position at fair value as set out in note 15. The fair
value of other financial assets approximates book value based on prevailing market rates. The fair value of borrowings, excluding finance
lease obligations and the fixed rate £250m 6% bonds, approximates book value as interest rates reset to market rates on a frequent basis.
The fair value of the £250m 6% bonds is based on the quoted market price. The fair value of the finance lease obligation is calculated by
discounting future cash flows at prevailing interest rates. The fair value of trade and other receivables, trade and other payables and
current provisions approximates to their carrying value, including the future redemption liability of the Group’s loyalty programme.
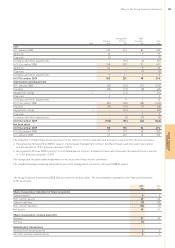
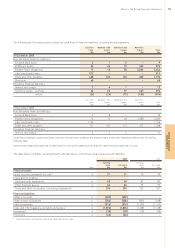
Fair value hierarchy
The Group uses the following valuation hierarchy to determine the carrying value of financial instruments that are measured at fair value:
Level 1: quoted (unadjusted) prices in active markets for identical assets or liabilities.
Level 2: other techniques for which all inputs which have a significant effect on the recorded fair value are observable, either directly or
indirectly.
Level 3: techniques which use inputs which have a significant effect on the recorded fair value that are not based on observable market data.
2009 2008
Level 1 Level 2 Level 3 Total Level 1 Level 2 Level 3 Total
$m $m $m $m $m $m $m $m
Assets
Equity securities available-for-sale 2 – 69 71 2 – 68 70
2009 2008
Level 1 Level 2 Level 3 Total Level 1 Level 2 Level 3 Total
$m $m $m $m $m $m $m $m
Liabilities
Derivatives – (20) – (20) – (10) – (10)
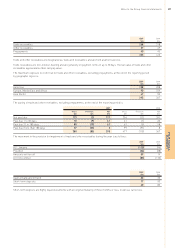
There were no transfers between Level 1 and Level 2 fair value measurements during the year and no transfers into and out of Level 3.
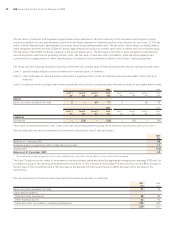
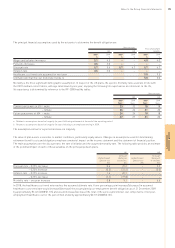
The following table reconciles movements in instruments classified as Level 3 during the year:
2009
$m
Balance at 1 January 2009 68
Valuation gains recognised in other comprehensive income 11
Impairment* (10)
Balance at 31 December 2009 69
* The impairment charge recognised in the income statement (see note 5) also includes $4m of losses reclassified from equity.
The Level 3 equity securities relate to investments in unlisted shares which are valued by applying an average price-earnings (P/E) ratio for
a competitor group to the earnings generated by the investment. A 10% increase in the average P/E ratio would result in a $5m increase in
the fair value of the investments and a 10% decrease in the average P/E ratio would result in a $5m decrease in the fair value of the
investments.
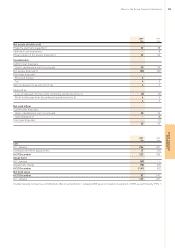
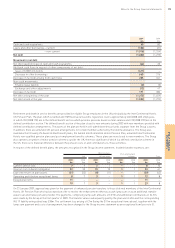
Credit risk
The carrying amount of financial assets represents the maximum exposure to credit risk.
2009 2008
$m $m
Equity securities available-for-sale 71 70
Loans and receivables:
Cash and cash equivalents 40 82
Other financial assets 64 92
Trade and other receivables, excluding prepayments 295 367
470 611
Notes to the Group financial statements continued