Holiday Inn 2009 Annual Report Download - page 16
Download and view the complete annual report
Please find page 16 of the 2009 Holiday Inn annual report below. You can navigate through the pages in the report by either clicking on the pages listed below, or by using the keyword search tool below to find specific information within the annual report.-
 1
1 -
2
-
3
-
4
-
5
-
 6
6 -
 7
7 -
 8
8 -
 9
9 -
 10
10 -
 11
11 -
 12
12 -
 13
13 -
 14
14 -
 15
15 -
 16
16 -
 17
17 -
 18
18 -
 19
19 -
 20
20 -
 21
21 -
 22
22 -
 23
23 -
 24
24 -
 25
25 -
 26
26 -
27
-
28
-
29
-
30
-
31
-
32
-
33
-
34
-
35
-
36
-
37
-
38
-
39
-
40
-
41
-
42
-
43
-
44
-
45
-
46
-
47
-
48
-
49
-
50
-
51
-
52
-
53
-
54
-
55
-
56
-
57
-
58
-
59
-
60
-
61
-
62
-
63
-
64
-
65
-
66
-
67
-
68
-
69
-
70
-
71
-
72
-
73
-
74
-
75
-
76
-
77
-
78
-
79
-
80
-
81
-
82
-
83
-
84
-
85
-
86
-
87
-
88
-
89
-
90
-
91
-
92
-
93
-
94
-
95
-
96
-
97
-
98
-
99
-
100
-
101
-
102
-
103
-
104
-
105
-
106
-
107
-
108
-
109
-
110
-
111
-
112
-
113
-
114
-
115
-
116
-
117
-
118
-
119
-
120
 |
 |

14 IHG Annual Report and Financial Statements 2009
Business review continued
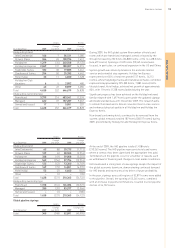
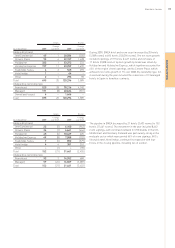
Americas results
The Americas
Americas strategic role 2010 priorities
12 months ended 31 December
2009 2008 %
$m $m change
Revenue
Franchised 437 495 (11.7)
Managed 110 168 (34.5)
Owned and leased 225 300 (25.0)
Total 772 963 (19.8)
Operating profit before exceptional items
Franchised 364 426 (14.6)
Managed (40) 51 (178.4)
Owned and leased 11 55 (80.0)
335 532 (37.0)
Regional overheads (47) (67) 29.9
Total 288 465 (38.1)
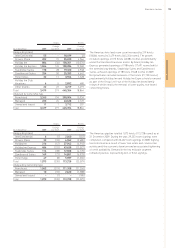
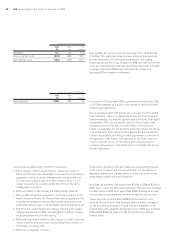
Americas comparable RevPAR movement on previous year
12 months ended
31 December 2009
Franchised
Crowne Plaza (15.9)%
Holiday Inn (15.5)%
Holiday Inn Express (12.9)%
All brands (14.3)%
Managed
InterContinental (16.2)%
Crowne Plaza (19.2)%
Holiday Inn (17.0)%
Staybridge Suites (14.8)%
Candlewood Suites (22.8)%
All brands (17.8)%
Owned and leased
InterContinental (28.2)%
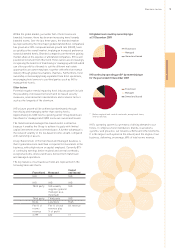
Revenue and operating profit before exceptional items decreased
by 19.8% to $772m and 38.1% to $288m respectively. Excluding the
receipt of significant liquidated damages of $13m in 2008, revenue
and operating profit declined by 18.7% and 36.3% respectively.
The region experienced challenging trading conditions throughout
the year leading to RevPAR, revenue and profit declines across all
ownership types. Despite RevPAR declines, the region’s US comparable
hotels demonstrated outperformance relative to the US market.
Franchised revenue and operating profit decreased by 11.7% to
$437m and 14.6% to $364m respectively, compared to 2008. This
decrease was predominantly driven by a fall in royalty revenues as
a consequence of a RevPAR decline of 14.3%. Revenues also
included the impact of a decline in real estate activity leading to
lower fees associated with activities such as the signing of new
hotels and conversions. An increase in overall room supply partially
offset the decline in revenue and profit.
Managed revenues decreased by 34.5% to $110m during the year
or, by 29.0% excluding the impact of $13m in liquidated damages
received in 2008. All brands were impacted by the economic
downturn which resulted in RevPAR declines of 17.8%. Operating
profit declined by $91m ($78m excluding liquidated damages)
resulting in a loss of $40m. The loss was due to RevPAR driven
revenue declines, IHG funding owner’s priority return shortfalls on
a number of hotels managed by one owner and certain guarantee
payments. At the year end, an exceptional charge of $91m was
recognised comprising the write off of a deposit related to the priority
return contracts and the total estimated net cash outflows to this
owner under the guarantee. Therefore, future payments to this
owner will be charged against the provision and will not impact
operating results. The managed results also included the impact of
provisions recognised following the devaluation of the Venezuelan
currency and the potential impact of asset nationalisation.
Results from managed operations included revenues of $71m
(2008 $88m) and operating profit of $nil (2008 $6m) from properties
that are structured, for legal reasons, as operating leases but with
the same characteristics as management contracts.
Owned and leased revenue declined by 25.0% to $225m and
operating profit decreased by 80.0% to $11m. Underlying trading
was driven by RevPAR declines, including the InterContinental
brand with a decline of 28.2%. Trading at the InterContinental New
York, in particular, was severely impacted by the collapse of the
financial markets. Results also included the impact of the sale
of the Holiday Inn Jamaica, sold in August 2008, which led to a
reduction in revenue and operating profit of $16m and $2m
respectively when compared to 2008.
As a result of the declining real estate market, the InterContinental
Atlanta and Staybridge Suites Denver Cherry Creek no longer
meet the criteria for designation as held for sale assets and
consequently the results of these hotels are no longer categorised
as discontinued operations and comparative figures have been
re-presented accordingly.
Regional overheads declined by 29.9% during the year, from $67m
to $47m. The favourable movement was driven by increased
efficiencies and the impact of an organisational restructuring
undertaken to further align the regional structure with the
requirements of IHG’s owners and hotels.
•Complete the roll-out of Holiday Inn repositioning;
•cascade Great Hotels Guests Love to the hotel level;
•optimise IHG’s growth and development efforts; and
•focus upscale distribution growth across the InterContinental,
Crowne Plaza and Hotel Indigo brands.
To optimise our core business and cash flow-generating
capability by focusing primarily on our substantial midscale
franchise business and profitable brand extensions
and adjacencies.