Holiday Inn 2009 Annual Report Download - page 72
Download and view the complete annual report
Please find page 72 of the 2009 Holiday Inn annual report below. You can navigate through the pages in the report by either clicking on the pages listed below, or by using the keyword search tool below to find specific information within the annual report.-
 1
1 -
2
-
3
-
4
-
5
-
6
-
7
-
8
-
9
-
10
-
11
-
12
-
13
-
14
-
15
-
16
-
17
-
18
-
19
-
20
-
21
-
22
-
23
-
24
-
25
-
26
-
27
-
28
-
29
-
30
-
31
-
32
-
33
-
34
-
35
-
36
-
37
-
38
-
39
-
40
-
41
-
42
-
43
-
44
-
45
-
46
-
47
-
48
-
49
-
50
-
51
-
52
-
53
-
54
-
55
-
56
-
57
-
58
-
59
-
60
-
61
-
 62
62 -
 63
63 -
 64
64 -
 65
65 -
 66
66 -
 67
67 -
 68
68 -
 69
69 -
 70
70 -
 71
71 -
 72
72 -
 73
73 -
 74
74 -
 75
75 -
 76
76 -
 77
77 -
 78
78 -
 79
79 -
 80
80 -
 81
81 -
 82
82 -
83
-
84
-
85
-
86
-
87
-
88
-
89
-
90
-
91
-
92
-
93
-
94
-
95
-
96
-
97
-
98
-
99
-
100
-
101
-
102
-
103
-
104
-
105
-
106
-
107
-
108
-
109
-
110
-
111
-
112
-
113
-
114
-
115
-
116
-
117
-
118
-
119
-
120
 |
 |

70 IHG Annual Report and Financial Statements 2009
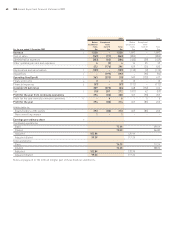
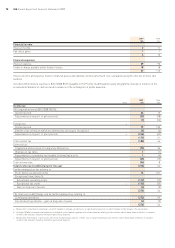
1 Exchange rates
The results of operations have been translated into US dollars
at the average rates of exchange for the year. In the case of
sterling, the translation rate is $1=£0.64 (2008 $1=£0.55). In the
case of the euro, the translation rate is $1=€0.72 (2008 $1=€0.68).
Assets and liabilities have been translated into US dollars at the
rates of exchange on the last day of the period. In the case of
sterling, the translation rate is $1=£0.62 (2008 $1=£0.69). In the
case of the euro, the translation rate is $1=€0.69 (2008 $1=€0.71).
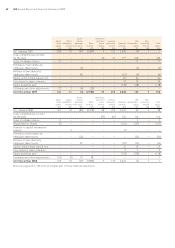
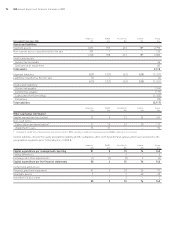
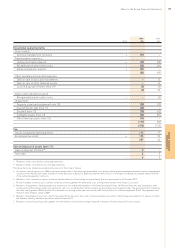
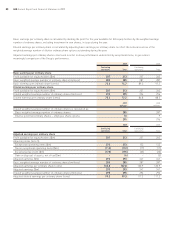
2 Segmental information
The management of the Group’s operations, excluding Central
functions, is organised within three geographical regions:
Americas;
Europe, Middle East and Africa (EMEA); and
Asia Pacific.
These, together with Central functions, comprise the Group’s four
reportable segments.
The Asia Pacific reportable segment comprises the aggregation
of two operating segments, Greater China and Asia Australasia.
Central functions include costs of global functions, including
technology, sales and marketing, finance, human resources and
corporate services; revenue arises principally from technology fee
income. Central liabilities include the loyalty programme liability
and the cumulative short-term System Fund surplus which were
allocated to the geographical segments prior to the adoption of
IFRS 8.
Each of the geographical regions derives its revenues from either
franchising, managing or owning hotels and additional segmental
disclosures are provided accordingly.
Management monitors the operating results of the geographical
regions and Central functions separately for the purpose of
making decisions about resource allocation and performance
assessment. Segmental performance is evaluated based on
operating profit or loss and is measured consistently with
operating profit or loss in the consolidated financial statements,
excluding exceptional items. Group financing and income
taxes are managed on a group basis and are not allocated
to reportable segments.
Notes to the Group financial statements