Holiday Inn 2009 Annual Report Download - page 22
Download and view the complete annual report
Please find page 22 of the 2009 Holiday Inn annual report below. You can navigate through the pages in the report by either clicking on the pages listed below, or by using the keyword search tool below to find specific information within the annual report.-
 1
1 -
2
-
3
-
4
-
5
-
6
-
7
-
8
-
9
-
10
-
11
-
 12
12 -
 13
13 -
 14
14 -
 15
15 -
 16
16 -
 17
17 -
 18
18 -
 19
19 -
 20
20 -
 21
21 -
 22
22 -
 23
23 -
 24
24 -
 25
25 -
 26
26 -
 27
27 -
 28
28 -
 29
29 -
 30
30 -
 31
31 -
 32
32 -
33
-
34
-
35
-
36
-
37
-
38
-
39
-
40
-
41
-
42
-
43
-
44
-
45
-
46
-
47
-
48
-
49
-
50
-
51
-
52
-
53
-
54
-
55
-
56
-
57
-
58
-
59
-
60
-
61
-
62
-
63
-
64
-
65
-
66
-
67
-
68
-
69
-
70
-
71
-
72
-
73
-
74
-
75
-
76
-
77
-
78
-
79
-
80
-
81
-
82
-
83
-
84
-
85
-
86
-
87
-
88
-
89
-
90
-
91
-
92
-
93
-
94
-
95
-
96
-
97
-
98
-
99
-
100
-
101
-
102
-
103
-
104
-
105
-
106
-
107
-
108
-
109
-
110
-
111
-
112
-
113
-
114
-
115
-
116
-
117
-
118
-
119
-
120
 |
 |

20 IHG Annual Report and Financial Statements 2009
Business review continued
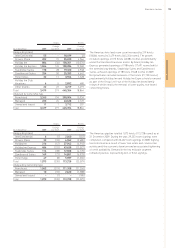
12 months ended 31 December
2009 2008 %
$m $m change
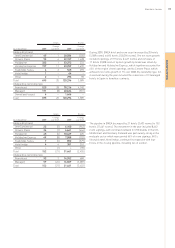
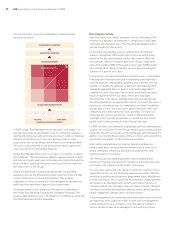
Assessments 1,008 990 1.8 In the year to 31 December 2009, assessments increased by 1.8%
to $1.01bn primarily as a result of the growth in system size and
marketing programmes.
Hotels operated under IHG brands are, pursuant to terms within
their contracts, subject to cash assessments for the provision of
brand marketing, reservations systems and the Priority Club loyalty
programme. These assessments, typically based upon room
revenue, are pooled for the collective benefit of all hotels by
brand or geography into the System Funds (the Funds). The Group
acts on behalf of hotel owners with regard to the Funds, and the
Owners’ Association, the IAHI, provides a governance overview of
the operation of the Funds. The operation of the Funds does not
result in a profit or loss for the Group and consequently the
revenues and expenses of the Funds are not included in the Group
Income Statement.
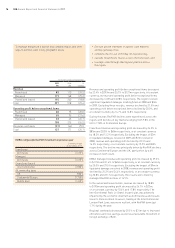
Exceptional operating items
Exceptional operating items of $373m consisted of:
• $91m charge, comprising an onerous contract provision of
$65m for the future net unavoidable costs under a performance
guarantee related to certain management contracts with one
US hotel owner, and a deposit of $26m written off as it is no
longer considered recoverable under the terms of the same
management contracts;
• $19m in relation to the Holiday Inn brand family relaunch;
• $21m enhanced pension transfers to deferred members of the
InterContinental Hotels UK Pension Plan who accepted an offer
to receive the enhancement as either a cash lump sum or an
additional transfer value to an alternative pension plan provider;
• $197m of non-cash impairment charges reflecting the weaker
trading environment in 2009, including $45m relating to hotels
reclassified from held for sale assets;
• $43m which primarily related to the closure of certain corporate
offices together with severance costs arising from a review of
the Group’s cost base; and
• $2m loss on disposal of hotels.
Exceptional operating items are treated as exceptional by reason
of their size or nature and are excluded from the calculation of
adjusted earnings per ordinary share in order to provide a more
meaningful comparison of performance.
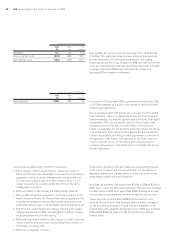
Net financial expenses
Net financial expenses decreased from $101m in 2008 to $54m in
2009, due to lower net debt levels and lower interest rates. Average
net debt levels in 2009 were lower than 2008 primarily as a result
of cost reduction programmes and an increased focus on cash.
Financing costs included $2m (2008 $12m) of interest costs
associated with Priority Club Rewards where interest is charged
on the accumulated balance of cash received in advance of the
redemption points awarded. Financing costs in 2009 also included
$18m (2008 $18m) in respect of the InterContinental Boston
finance lease.
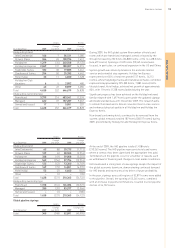
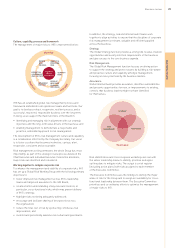
Central
Central results
System Funds
System Fund results
Other financial information
12 months ended 31 December
2009 2008 %
$m $m change
Revenue 124 126 (1.6)
Gross central costs (228) (281) 18.9
Net central costs (104) (155) 32.9
During 2009, net central costs decreased by 32.9% from $155m
to $104m. The significant reduction was driven by management
actions to increase efficiencies and implement cost-saving
measures across the Group. Relative to 2008, the 2009 net central
costs also benefited from a $16m favourable movement in foreign
exchange whilst the 2008 results included the receipt of a
favourable $3m insurance settlement.