Holiday Inn 2009 Annual Report Download - page 21
Download and view the complete annual report
Please find page 21 of the 2009 Holiday Inn annual report below. You can navigate through the pages in the report by either clicking on the pages listed below, or by using the keyword search tool below to find specific information within the annual report.-
 1
1 -
2
-
3
-
4
-
5
-
6
-
7
-
8
-
9
-
10
-
 11
11 -
 12
12 -
 13
13 -
 14
14 -
 15
15 -
 16
16 -
 17
17 -
 18
18 -
 19
19 -
 20
20 -
 21
21 -
 22
22 -
 23
23 -
 24
24 -
 25
25 -
 26
26 -
 27
27 -
 28
28 -
 29
29 -
 30
30 -
 31
31 -
32
-
33
-
34
-
35
-
36
-
37
-
38
-
39
-
40
-
41
-
42
-
43
-
44
-
45
-
46
-
47
-
48
-
49
-
50
-
51
-
52
-
53
-
54
-
55
-
56
-
57
-
58
-
59
-
60
-
61
-
62
-
63
-
64
-
65
-
66
-
67
-
68
-
69
-
70
-
71
-
72
-
73
-
74
-
75
-
76
-
77
-
78
-
79
-
80
-
81
-
82
-
83
-
84
-
85
-
86
-
87
-
88
-
89
-
90
-
91
-
92
-
93
-
94
-
95
-
96
-
97
-
98
-
99
-
100
-
101
-
102
-
103
-
104
-
105
-
106
-
107
-
108
-
109
-
110
-
111
-
112
-
113
-
114
-
115
-
116
-
117
-
118
-
119
-
120
 |
 |

Business review 19
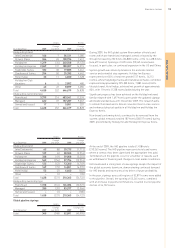
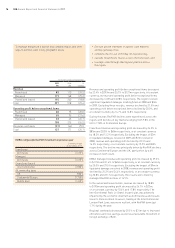
Asia Pacific hotel and room count
Hotels Rooms
Change Change
At 31 December 2009 over 2008 2009 over 2008
Analysed by brand
InterContinental 46 617,036 1,638
Crowne Plaza 71 523,147 1,618
Holiday Inn 102 128,995 1,120
Holiday Inn Express 26 26,464 258
Other 19 (1) 5,387 (259)
Total 264 13 81,029 4,375
Analysed by ownership type
Franchised 34 (8) 7,321 (2,500)
Managed 228 21 73,015 6,875
Owned and leased 2–693 –
Total 264 13 81,029 4,375
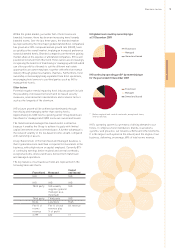
Asia Pacific hotel and room count increased by 13 hotels
(4,375 rooms) to 264 hotels (81,029 rooms), including the opening
of 27 hotels (8,334 rooms) offset by the removal of 14 hotels
(3,959 rooms). The growth was predominantly driven by the opening
of 17 hotels (5,776 rooms) in Greater China reflecting continued
expansion in one of IHG’s strategic markets.
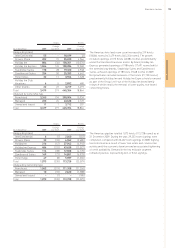
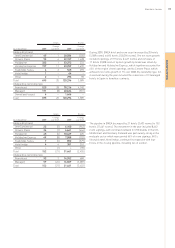
Asia Pacific pipeline
Hotels Rooms
Change Change
At 31 December 2009 over 2008 2009 over 2008
Analysed by brand
InterContinental 34 (2) 12,033 (496)
Crowne Plaza 72 724,952 417
Holiday Inn 77 320,637 (568)
Holiday Inn Express 28 57,230 1,215
Hotel Indigo 21322 142
Total 213 14 65,174 710
Analysed by ownership type
Franchised 2–326 (1)
Managed 211 14 64,848 711
Total 213 14 65,174 710
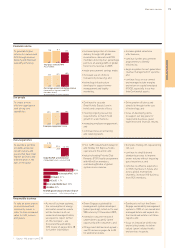
The pipeline in Asia Pacific increased by 14 hotels (710 rooms)
to 213 hotels (65,174 rooms). Pipeline growth was fuelled by the
Greater China market which generated 75% of the region’s room
signings, followed by India, which contributed a further 16%.
From a brand perspective, Crowne Plaza experienced the highest
demand with 45% of the region’s room signings, followed by
Holiday Inn, which contributed a further 32%. During the year,
the first Hotel Indigo was signed in Hong Kong.
BUSINESS REVIEW