Holiday Inn 2009 Annual Report Download - page 10
Download and view the complete annual report
Please find page 10 of the 2009 Holiday Inn annual report below. You can navigate through the pages in the report by either clicking on the pages listed below, or by using the keyword search tool below to find specific information within the annual report.-
 1
1 -
 2
2 -
 3
3 -
 4
4 -
 5
5 -
 6
6 -
 7
7 -
 8
8 -
 9
9 -
 10
10 -
 11
11 -
 12
12 -
 13
13 -
 14
14 -
 15
15 -
 16
16 -
 17
17 -
 18
18 -
 19
19 -
 20
20 -
 21
21 -
22
-
23
-
24
-
25
-
26
-
27
-
28
-
29
-
30
-
31
-
32
-
33
-
34
-
35
-
36
-
37
-
38
-
39
-
40
-
41
-
42
-
43
-
44
-
45
-
46
-
47
-
48
-
49
-
50
-
51
-
52
-
53
-
54
-
55
-
56
-
57
-
58
-
59
-
60
-
61
-
62
-
63
-
64
-
65
-
66
-
67
-
68
-
69
-
70
-
71
-
72
-
73
-
74
-
75
-
76
-
77
-
78
-
79
-
80
-
81
-
82
-
83
-
84
-
85
-
86
-
87
-
88
-
89
-
90
-
91
-
92
-
93
-
94
-
95
-
96
-
97
-
98
-
99
-
100
-
101
-
102
-
103
-
104
-
105
-
106
-
107
-
108
-
109
-
110
-
111
-
112
-
113
-
114
-
115
-
116
-
117
-
118
-
119
-
120
 |
 |

8IHGAnnual Report and Financial Statements 2009
This Business Review for
the financial year ended
31 December 2009 provides
a review of the business and
strategy of InterContinental
Hotels Group PLC (the Group
or IHG), commentaries on the
development and performance
of the business, employee and
environmental matters and a
description of the risks and
uncertainties impacting
the business.
Business overview
Market and competitive environment
Global economic events and industry cycle
The economic conditions of the last year have had a significant
impact on IHG and the wider hotel industry. We continue to monitor
key trends and business fundamentals, such as revenue per
available room (RevPAR) to ensure our strategy remains well
suited to the developing environment and our capabilities, and we
believe our business is resilient. Accordingly, our strategy remains
unchanged. However, we see short-term risks in the pace of future
openings and the recovery in consumer demand, particularly
business travel.
The downturn continued to be severe in 2009, with a sharp decline
in global industry RevPAR and bookings. Our industry has always
been cyclical and there are signs that business and consumer
confidence is returning and RevPAR is beginning a slow recovery.
Historically as an industry, in previous cycles, we have experienced
periods of five to eight years of RevPAR growth followed by up to
two years of declines in RevPAR. Demand has rarely fallen for
sustained periods and it is the interplay between hotel supply and
demand in the industry that drives longer-term fluctuations in
RevPAR. The difference in the recovery this time is likely to be
slower increases in supply due to the ongoing finance environment
remaining at more ‘normal’ levels compared with 2005 to 2008,
and muted demand recovery as discretionary income growth and
corporate profit growth are held back by, amongst other issues,
tax increases and reduced access to credit. The Group’s fee-based
profit is partly protected from changes in hotel supply or demand
due to its model of third-party ownership of hotels under IHG
franchise and management contracts. IHG profit varies more with
hotel revenue (demand) than it does with hotel profit performance.
Accordingly, IHG’s share price saw some significant recovery and
stabilisation since the lows of last spring. Our share price
increased by 59% in the 12 months to 31 December 2009 and those
of our listed company competitors increased by an average 56%
over the same period. We believe we are well placed over the
coming year compared with competitors who own hotels, rather
than simply operate them, as IHG does.
Market size
The global hotel market has an estimated room capacity of
18 million rooms. This has grown at approximately 2% per
annum over the last five years. Competitors in the market include
other hotel companies, both large and small, and independently
owned hotels.
The market remains fragmented, with an estimated eight million
branded hotel rooms (approximately 45% of the total market). IHG
has an estimated 8% share of the branded market (approximately
3% of the total market). The top six major companies, including
IHG, together control approximately 41% of the branded rooms,
only 18% of total hotel rooms.
Geographically, the market is more concentrated with the top
20 countries accounting for more than 80% of global hotel rooms.
Within this, the United States (US) is dominant (approximately 25%
of global hotel rooms) with China, Spain and Italy being the next
largest markets. The Group’s brands have more leadership
positions (top three by room numbers) in the six largest geographic
markets than any other major hotel company.
Drivers of growth
US market data historically indicates a steady increase in hotel
industry revenues, broadly in line with Gross Domestic Product
(GDP), with growth of approximately 1.5% per annum in real terms
since 1967.
Globally, we believe demand is driven by a number of underlying
trends:
• change in demographics – as the population ages and becomes
wealthier, increased leisure time and income encourages more
travel and hotel visits: younger generations are increasingly
seeking work/life balance, with positive implications for
increased leisure travel;
• increase in travel volumes as airline capacity grows and
affordability improves, accentuated in some regions by the
strength of the market positions of low-cost airlines;
• globalisation of trade and tourism;
• increase in affluence and freedom to travel within emerging
markets, such as China and Brazil; and
• increase in the preference for branded hotels amongst consumers.
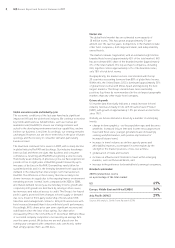
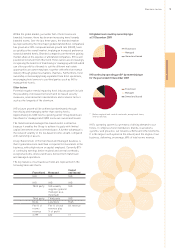
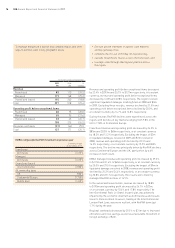
Branded v unbranded
2009 branded hotel rooms
as a percentage of the total market
US 69%
Europe, Middle East and Africa (EMEA) 34%
Asia Pacific (APAC) 29%
Source: IHG analysis, Smith Travel Research (STR).
Business review