Holiday Inn 2009 Annual Report Download - page 62
Download and view the complete annual report
Please find page 62 of the 2009 Holiday Inn annual report below. You can navigate through the pages in the report by either clicking on the pages listed below, or by using the keyword search tool below to find specific information within the annual report.-
 1
1 -
2
-
3
-
4
-
5
-
6
-
7
-
8
-
9
-
10
-
11
-
12
-
13
-
14
-
15
-
16
-
17
-
18
-
19
-
20
-
21
-
22
-
23
-
24
-
25
-
26
-
27
-
28
-
29
-
30
-
31
-
32
-
33
-
34
-
35
-
36
-
37
-
38
-
39
-
40
-
41
-
42
-
43
-
44
-
45
-
46
-
47
-
48
-
49
-
50
-
51
-
 52
52 -
 53
53 -
 54
54 -
 55
55 -
 56
56 -
 57
57 -
 58
58 -
 59
59 -
 60
60 -
 61
61 -
 62
62 -
 63
63 -
 64
64 -
 65
65 -
 66
66 -
 67
67 -
 68
68 -
 69
69 -
 70
70 -
 71
71 -
 72
72 -
73
-
74
-
75
-
76
-
77
-
78
-
79
-
80
-
81
-
82
-
83
-
84
-
85
-
86
-
87
-
88
-
89
-
90
-
91
-
92
-
93
-
94
-
95
-
96
-
97
-
98
-
99
-
100
-
101
-
102
-
103
-
104
-
105
-
106
-
107
-
108
-
109
-
110
-
111
-
112
-
113
-
114
-
115
-
116
-
117
-
118
-
119
-
120
 |
 |

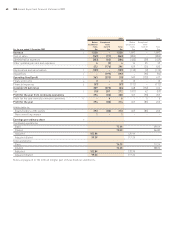
60 IHG Annual Report and Financial Statements 2009
Group income statement
2009 2008
Before Exceptional Before Exceptional
exceptional items exceptional items
items (note 5) Total items (note 5) Total
For the year ended 31 December 2009 Note $m $m $m $m $m $m
Revenue 21,538 – 1,538 1,897 – 1,897
Cost of sales (769) (91) (860) (852) – (852)
Administrative expenses (303) (83) (386) (400) (59) (459)
Other operating income and expenses 6 (2) 4 14 25 39
472 (176) 296 659 (34) 625
Depreciation and amortisation 2(109) – (109) (110) (2) (112)
Impairment 2– (197) (197) – (96) (96)
Operating (loss)/profit 2363 (373) (10) 549 (132) 417
Financial income 63–312 – 12
Financial expenses 6(57) – (57) (113) – (113)
(Loss)/profit before tax 309 (373) (64) 448 (132) 316
Tax 7(15) 287 272 (101) 42 (59)
Profit for the year from continuing operations 294 (86) 208 347 (90) 257
Profit for the year from discontinued operations 11 –66–55
Profit for the year 294 (80) 214 347 (85) 262
Attributable to:
Equity holders of the parent 293 (80) 213 347 (85) 262
Non-controlling interest 1–1–––
Earnings per ordinary share 9
Continuing operations:
Basic 72.6¢ 89.5¢
Diluted 70.2¢ 86.8¢
Adjusted 102.8¢ 120.9¢
Adjusted diluted 99.3¢ 117.2¢
Total operations:
Basic 74.7¢ 91.3¢
Diluted 72.2¢ 88.5¢
Adjusted 102.8¢ 120.9¢
Adjusted diluted 99.3¢ 117.2¢
Notes on pages 65 to 104 form an integral part of these financial statements.
Group financial statements