Holiday Inn 2009 Annual Report Download - page 14
Download and view the complete annual report
Please find page 14 of the 2009 Holiday Inn annual report below. You can navigate through the pages in the report by either clicking on the pages listed below, or by using the keyword search tool below to find specific information within the annual report.-
 1
1 -
2
-
3
-
 4
4 -
 5
5 -
 6
6 -
 7
7 -
 8
8 -
 9
9 -
 10
10 -
 11
11 -
 12
12 -
 13
13 -
 14
14 -
 15
15 -
 16
16 -
 17
17 -
 18
18 -
 19
19 -
 20
20 -
 21
21 -
 22
22 -
 23
23 -
 24
24 -
25
-
26
-
27
-
28
-
29
-
30
-
31
-
32
-
33
-
34
-
35
-
36
-
37
-
38
-
39
-
40
-
41
-
42
-
43
-
44
-
45
-
46
-
47
-
48
-
49
-
50
-
51
-
52
-
53
-
54
-
55
-
56
-
57
-
58
-
59
-
60
-
61
-
62
-
63
-
64
-
65
-
66
-
67
-
68
-
69
-
70
-
71
-
72
-
73
-
74
-
75
-
76
-
77
-
78
-
79
-
80
-
81
-
82
-
83
-
84
-
85
-
86
-
87
-
88
-
89
-
90
-
91
-
92
-
93
-
94
-
95
-
96
-
97
-
98
-
99
-
100
-
101
-
102
-
103
-
104
-
105
-
106
-
107
-
108
-
109
-
110
-
111
-
112
-
113
-
114
-
115
-
116
-
117
-
118
-
119
-
120
 |
 |

12 IHG Annual Report and Financial Statements 2009
Business review continuedBusiness review continued
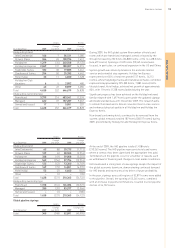
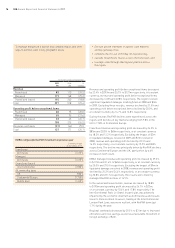
Group performance
Group results
Total gross revenue
12 months ended 31 December
2009 2008 %
$bn $bn change
InterContinental 3.8 4.1 (7.3)
Crowne Plaza 3.0 3.2 (6.3)
Holiday Inn 5.4 6.8 (20.6)
Holiday Inn Express 3.6 3.9 (7.7)
Staybridge Suites 0.4 0.4 –
Candlewood Suites 0.3 0.3 –
Other brands 0.3 0.4 (25.0)
Total 16.8 19.1 (12.0)
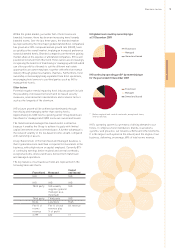
One measure of overall IHG hotel system performance is the
growth in total gross revenue, defined as total room revenue from
franchised hotels and total hotel revenue from managed, owned
and leased hotels. Total gross revenue is not revenue attributable
to IHG, as it is derived mainly from hotels owned by third parties.
Total gross revenue decreased by 12.0% from $19.1bn in 2008 to
$16.8bn in 2009. Translated at constant currency, total gross
revenue decreased by 9.9%.
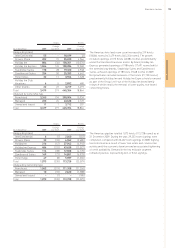
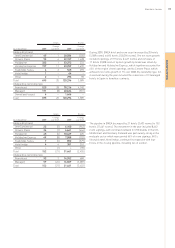
12 months ended 31 December
2009 2008 %
$m $m change
Revenue
Americas 772 963 (19.8)
EMEA 397 518 (23.4)
Asia Pacific 245 290 (15.5)
Central 124 126 (1.6)
1,538 1,897 (18.9)
Operating profit
Americas 288 465 (38.1)
EMEA 127 171 (25.7)
Asia Pacific 52 68 (23.5)
Central (104) (155) 32.9
363 549 (33.9)
Exceptional operating items (373) (132) (182.6)
(10) 417 (102.4)
Net financial expenses (54) (101) 46.5
(Loss)/profit before tax (64) 316 (120.3)
Earnings per ordinary share
Basic 74.7¢ 91.3¢ (18.2)
Adjusted 102.8¢ 120.9¢ (15.0)
Revenue decreased by 18.9% to $1,538m and operating profit
before exceptional items decreased by 33.9% to $363m during the
12 months ended 31 December 2009. Included in these results are
$3m of significant liquidated damages received by IHG in 2009 in
respect of the settlement of a franchise contract in the EMEA
region. During 2008, significant liquidated damages totalling $33m
were received across the Group. Excluding these, revenue and
operating profit before exceptional items decreased by 17.7%
and 30.2% respectively.
The results reflect the challenging global economic environment
faced by the Group throughout 2009. Group RevPAR fell 14.7%
during the year, with declines in both occupancy and rate.
However, stabilising occupancy levels in the fourth quarter
indicated a slight rebound in trading conditions which resulted in
a RevPAR decline of 10.9% compared to the fourth quarter in 2008.
Furthermore, IHG continued to achieve organic growth during the
year, increasing its net room count by 4.3% or 26,828 rooms. The
Group also made significant progress in the roll-out of the Holiday
Inn brand family relaunch, with 1,697 hotels converted globally as
at 31 December 2009.
In the year, the Group took a number of actions to improve
efficiency and reduce costs which led to a reduction in regional and
central overheads of $95m, from $304m in 2008 to $209m in 2009,
including a $23m favourable movement in foreign exchange.
As a result of the declining real estate market, the InterContinental
Atlanta and Staybridge Suites Denver Cherry Creek no longer meet
the criteria for designation as held for sale assets. Consequently,
these hotels are no longer categorised as discontinued operations
and comparative figures have been re-presented accordingly.
The average US dollar exchange rate strengthened against sterling
during 2009 (2009 $1=£0.64, 2008 $1=£0.55). Translated at constant
currency, applying 2008 exchange rates, revenue decreased by
17.0% and operating profit decreased by 35.9%.
The results include an exceptional operating charge of $373m,
which included a $91m charge comprising the write off of a cash
deposit related to certain management contracts with one US hotel
owner and the total estimated net cash outflows to this owner
under the guarantee, and $197m non-cash impairment charges.
Profit before tax was a loss of $64m for the year, compared to
a profit of $316m in 2008. Basic earnings per ordinary share
decreased by 18.2% to 74.7¢ and adjusted earnings per ordinary
share decreased by 15.0% to 102.8¢.