Holiday Inn 2009 Annual Report Download - page 52
Download and view the complete annual report
Please find page 52 of the 2009 Holiday Inn annual report below. You can navigate through the pages in the report by either clicking on the pages listed below, or by using the keyword search tool below to find specific information within the annual report.-
 1
1 -
2
-
3
-
4
-
5
-
6
-
7
-
8
-
9
-
10
-
11
-
12
-
13
-
14
-
15
-
16
-
17
-
18
-
19
-
20
-
21
-
22
-
23
-
24
-
25
-
26
-
27
-
28
-
29
-
30
-
31
-
32
-
33
-
34
-
35
-
36
-
37
-
38
-
39
-
40
-
41
-
 42
42 -
 43
43 -
 44
44 -
 45
45 -
 46
46 -
 47
47 -
 48
48 -
 49
49 -
 50
50 -
 51
51 -
 52
52 -
 53
53 -
 54
54 -
 55
55 -
 56
56 -
 57
57 -
 58
58 -
 59
59 -
 60
60 -
 61
61 -
 62
62 -
63
-
64
-
65
-
66
-
67
-
68
-
69
-
70
-
71
-
72
-
73
-
74
-
75
-
76
-
77
-
78
-
79
-
80
-
81
-
82
-
83
-
84
-
85
-
86
-
87
-
88
-
89
-
90
-
91
-
92
-
93
-
94
-
95
-
96
-
97
-
98
-
99
-
100
-
101
-
102
-
103
-
104
-
105
-
106
-
107
-
108
-
109
-
110
-
111
-
112
-
113
-
114
-
115
-
116
-
117
-
118
-
119
-
120
 |
 |

50 IHG Annual Report and Financial Statements 2009
Remuneration report continued
Each year, specific quantitative targets against individual
performance measures are set for each Executive Director
and Executive Committee member, as relevant to their role.
Performance against these measures is reviewed at the end
of each year to determine bonus outcomes.
In 2009, under the financial measure (EBIT), threshold payout
was 90% of target performance, with maximum payout at 110%
or more of target. Payout for individual performance would be
reduced by half if EBIT performance was below threshold.
In addition, no annual bonus would be payable on any measure
if EBIT performance was lower than 85% of target.
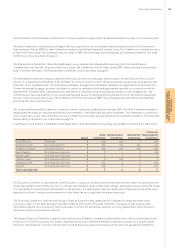
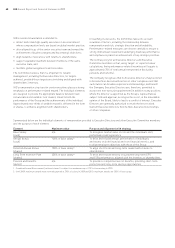
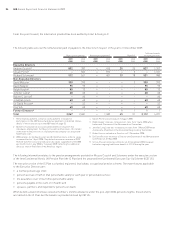
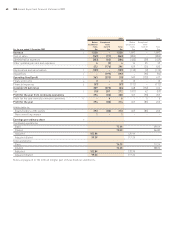
Outcomes in 2009
The following table shows the performance in 2009 against KPOs.
Measure Key performance indicator Payout as % of salary
Target Max
2
Actual
Financial (70%) EBIT 80.5 161 Zero
Individual (30%) OPR
1
– Andrew Cosslett 34.5 69 Zero
OPR
1
– Richard Solomons 34.5 69 Zero
1 Overall Performance Rating for individual performance.
2 Combined EBIT and OPR payout, subject to a maximum of 200%
of base salary.
Structure in 2010
The Annual Bonus structure remains largely unchanged in 2010
with awards under the ABP continuing to require the achievement
of challenging performance goals before target bonus is payable.
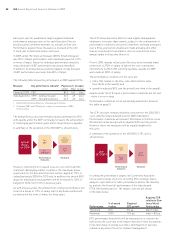
A summary of the operation of the 2010 ABP is shown below.
However, reflecting the increased focus on cost control and the
continued challenging market conditions, the maximum bonus
opportunity for the Executive Directors will be capped at 175% of
salary (previously 200%) for 2010 only. In addition, the stretch EBIT
target for maximum bonus payment will be increased to 120% of
budget for 2010, from 110% in previous years.
As with previous years, the achievement of target performance will
result in a bonus of 115% of salary. Half of any bonus earned will
be deferred in the form of shares for three years.
5 Long Term Incentive Plan (LTIP)
The LTIP allows Executive Directors and eligible management
employees to receive share awards, subject to the achievement of
performance conditions set by the Committee, normally measured
over a three-year period. Awards are made annually and, other
than in exceptional circumstances, will not exceed three times
annual salary for Executive Directors.
Structure for 2009/2011 cycle
Prior to 2009, awards to Executive Directors were normally made
at the level of 270% of salary. In light of the cost-constrained
environment in which IHG currently operates, awards for 2009
were made at 205% of salary.
The performance conditions for the cycle are:
• IHG’s TSR relative to the Dow Jones World Hotels index
(two-thirds of the award); and
• growth in adjusted EPS over the period (one-third of the award).
Awards under the LTIP lapse if performance conditions are not met
– there is no re-testing.
Performance conditions for all outstanding awards are shown in
the table on page 51.
Structure for 2010/2012 cycle
The LTIP structure remains relatively consistent for the 2010/2012
cycle, with the reduced award level for 2009 maintained.
Performance conditions will remain TSR relative to the Dow Jones
World Hotels index and growth in adjusted EPS over the period.
However, these two measures will be equally weighted for
this cycle.
A summary of the operation of the 2010/2012 LTIP cycle is
shown below.
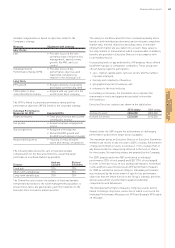
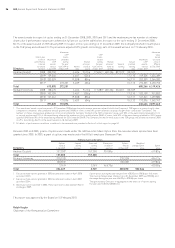
In setting the performance targets, the Committee has taken
into account a range of factors, including IHG’s strategic plans,
analysts’ expectations for IHG’s performance and for the industry
as a whole, the historical performance of the industry and
FTSE 100 market practice. The targets selected are shown
in the table below.
Required TSR
relative to Dow
% of award Required Jones World
Performance vesting EPS growth Hotels index
Threshold 20% 5% pa Match index
Maximum 100% 15% pa Index + 8% pa
EPS performance henceforth will be measured on a constant tax
rate across the cycle due to the impact that short-term fluctuations
in tax rates have on vesting outcomes. Optimisation of tax rates
remains a key area of focus for relevant management.
Performance
measures Structure
LTIP
2010/2012
50%
EPS
100%
Shares
50%
TSR
Performance
measures Structure
Annual
Bonus
for 2010
70%
EBIT
50%
Cash
30%
Individual
50%
Deferred
Shares