Holiday Inn 2009 Annual Report Download - page 115
Download and view the complete annual report
Please find page 115 of the 2009 Holiday Inn annual report below. You can navigate through the pages in the report by either clicking on the pages listed below, or by using the keyword search tool below to find specific information within the annual report.-
 1
1 -
2
-
3
-
4
-
5
-
6
-
7
-
8
-
9
-
10
-
11
-
12
-
13
-
14
-
15
-
16
-
17
-
18
-
19
-
20
-
21
-
22
-
23
-
24
-
25
-
26
-
27
-
28
-
29
-
30
-
31
-
32
-
33
-
34
-
35
-
36
-
37
-
38
-
39
-
40
-
41
-
42
-
43
-
44
-
45
-
46
-
47
-
48
-
49
-
50
-
51
-
52
-
53
-
54
-
55
-
56
-
57
-
58
-
59
-
60
-
61
-
62
-
63
-
64
-
65
-
66
-
67
-
68
-
69
-
70
-
71
-
72
-
73
-
74
-
75
-
76
-
77
-
78
-
79
-
80
-
81
-
82
-
83
-
84
-
85
-
86
-
87
-
88
-
89
-
90
-
91
-
92
-
93
-
94
-
95
-
96
-
97
-
98
-
99
-
100
-
101
-
102
-
103
-
104
-
 105
105 -
 106
106 -
 107
107 -
 108
108 -
 109
109 -
 110
110 -
 111
111 -
 112
112 -
 113
113 -
 114
114 -
 115
115 -
 116
116 -
 117
117 -
 118
118 -
 119
119 -
 120
120
 |
 |

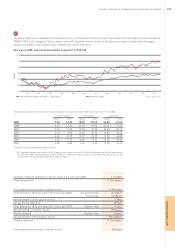
Glossary and Shareholder profiles 113
Shareholder profile as at 31 December 2009 by type
Number of Percentage of Ordinary Percentage of
shareholders total shareholders shares issued share capital
Category of holdings
Private individuals 54,888 94.73 21,040,274 7.33
Nominee companies 2,640 4.56 259,923,974 90.57
Limited and public limited companies 274 0.47 2,743,686 0.96
Other corporate bodies 128 0.22 2,621,851 0.91
Pension funds, insurance companies and banks 13 0.02 646,282 0.23
Total 57,943 100 286,976,067 100
Shareholder profile as at 31 December 2009 by size
Number of Percentage of Ordinary Percentage of
shareholders total shareholders shares issued share capital
Range of holdings
1 – 199 35,302 60.93 2,318,294 0.81
200 – 499 11,830 20.42 3,785,499 1.32
500 – 999 5,796 10.00 4,056,528 1.41
1,000 – 4,999 4,078 7.04 7,540,518 2.63
5,000 -9,999 313 0.54 2,171,997 0.76
10,000 – 49,999 303 0.52 6,464,131 2.25
50,000 – 99,999 94 0.16 6,523,992 2.27
100,000 – 499,999 153 0.26 33,368,968 11.63
500,000 – 999,999 31 0.05 22,962,489 8.00
1,000,000 – highest 43 0.07 197,783,651 68.92
Total 57,943 100 286,976,067 100
Shareholder profile as at 31 December 2009 by geographical location
Percentage of
issued share capital1
Country/Jurisdiction
England and Wales 59.51
Rest of Europe 10.20
USA (including ADRs) 24.69
Rest of World 5.60
Total 100
1 The geographical profile presented is based on an analysis of shareholders (by manager) of 150,000 shares or above where geographical ownership is known. This
analysis only captures 84.7% of total issued share capital. Therefore, the known percentage distributions have been multiplied by 100⁄84.7 (1.181) to achieve
the figures shown in the table above.
Shareholder profiles
USEFUL INFORMATION