Cigna 2008 Annual Report Download - page 88
Download and view the complete annual report
Please find page 88 of the 2008 Cigna annual report below. You can navigate through the pages in the report by either clicking on the pages listed below, or by using the keyword search tool below to find specific information within the annual report.-
 1
1 -
2
-
3
-
4
-
5
-
6
-
7
-
8
-
9
-
10
-
11
-
12
-
13
-
14
-
15
-
16
-
17
-
18
-
19
-
20
-
21
-
22
-
23
-
24
-
25
-
26
-
27
-
28
-
29
-
30
-
31
-
32
-
33
-
34
-
35
-
36
-
37
-
38
-
39
-
40
-
41
-
42
-
43
-
44
-
45
-
46
-
47
-
48
-
49
-
50
-
51
-
52
-
53
-
54
-
55
-
56
-
57
-
58
-
59
-
60
-
61
-
62
-
63
-
64
-
65
-
66
-
67
-
68
-
69
-
70
-
71
-
72
-
73
-
74
-
75
-
76
-
77
-
 78
78 -
 79
79 -
 80
80 -
 81
81 -
 82
82 -
 83
83 -
 84
84 -
 85
85 -
 86
86 -
 87
87 -
 88
88 -
 89
89 -
 90
90 -
 91
91 -
 92
92 -
 93
93 -
 94
94 -
 95
95 -
 96
96 -
 97
97 -
 98
98 -
99
-
100
-
101
-
102
-
103
-
104
-
105
-
106
-
107
-
108
-
109
-
110
-
111
-
112
-
113
-
114
-
115
-
116
-
117
-
118
-
119
-
120
-
121
-
122
-
123
-
124
-
125
-
126
-
127
-
128
-
129
-
130
-
131
-
132
-
133
-
134
-
135
-
136
-
137
-
138
-
139
-
140
-
141
-
142
-
143
-
144
-
145
-
146
-
147
-
148
-
149
-
150
-
151
-
152
-
153
-
154
-
155
-
156
-
157
-
158
-
159
-
160
-
161
-
162
-
163
-
164
-
165
-
166
-
167
-
168
-
169
-
170
-
171
-
172
-
173
-
174
-
175
-
176
-
177
-
178
-
179
-
180
-
181
-
182
-
183
-
184
-
185
-
186
-
187
-
188
-
189
-
190
-
191
-
192
 |
 |

68
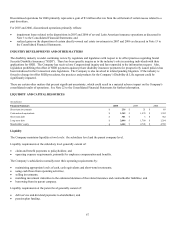
The parent normally meets its liquidity requirements by:
• maintaining appropriate levels of cash, cash equivalents and short-term investments;
• collecting dividends from its subsidiaries;
• using proceeds from issuance of debt and equity securities;
• collecting pension contributions from subsidiaries in the amount of the GAAP expense charged; and
• borrowing from its subsidiaries.
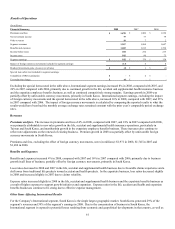
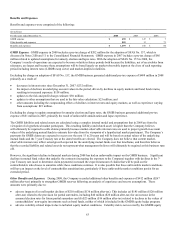
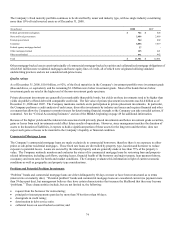
Cash flows for the years ended December 31, were as follows:
(In millions) 2008 2007 2006
Operating activities $ 1,656 $ 1,342 $ 642
Investing activities $(2,572) $ 269 $ 1,548
Financing activities $ 314 $ (1,041) $(2,513)
Cash flow from operating activities consists of cash receipts and disbursements for premiums and fees, gains (losses) recognized in
connection with the Company’s GMDB equity hedge program, investment income, taxes, and benefits and expenses.
Because certain income and expense transactions do not generate cash, and because cash transactions related to revenue and expenses
may occur in periods different from when those revenues and expenses are recognized in net income, cash flow from operating
activities can be significantly different from net income. The Company assesses cash flows from operating activities by comparing it
with adjusted income from operations, which is defined as income from continuing operations excluding the results of GMIB and
special items, and further adjusted to exclude pre-tax realized investment results and depreciation and amortization charges.
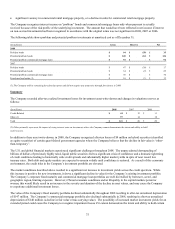
Cash flows from investing activities generally consist of net investment purchases or sales and net purchases of property and
equipment, which includes capitalized software, as well as cash used to acquire businesses.
Cash flows from financing activities is generally comprised of issuances and re-payment of debt at the parent level, proceeds on the
issuance of common stock resulting from stock option exercises, and stock repurchases. In addition, the subsidiaries report net
deposits/withdrawals to/from investment contract liabilities (which include universal life insurance liabilities) because such liabilities
are considered financing activities with policyholders.
2008:
Operating activities
For the year ended December 31, 2008, cash flows from operating activities were greater than adjusted income from operations by
$406 million, including cash inflows of $333 million associated with the GMDB equity hedge program which did not affect net
income. Excluding those inflows, cash flows from operating activities were higher than adjusted income from operations by $73
million, primarily reflecting favorable receivable collections and increases in GMDB reserves due to the 2008 charges. These factors
were partially offset by payments for certain prepaid expenses and litigation matters.
Cash flows from operating activities increased by $314 million in 2008 compared with 2007. Excluding the results of the GMDB
equity hedge program (which did not affect net income), cash flows from operating activities decreased by $51 million. This
decrease in 2008 primarily reflects higher payments for certain prepaid expenses in 2008.
Investing activities
The Company used net cash of $1.3 billion to fund the acquisition of Great-West Healthcare, consisting of a cash payment to Great-
West Life and Annuity, Inc. of approximately $1.4 billion, partially offset by cash acquired from Great-West Healthcare of
approximately $0.1 billion. Excluding this item, cash used in investing activities was $1.3 billion. This use of cash primarily
consisted of net purchases of investments of $988 million and net purchases of property and equipment of $257 million.
Financing activities
Cash provided from financing activities primarily consisted of proceeds from the net issuance of short-term debt of $298 million and
long-term debt of $297 million. These borrowing arrangements were entered into for general corporate purposes, including the