Cigna 2008 Annual Report Download - page 104
Download and view the complete annual report
Please find page 104 of the 2008 Cigna annual report below. You can navigate through the pages in the report by either clicking on the pages listed below, or by using the keyword search tool below to find specific information within the annual report.-
 1
1 -
2
-
3
-
4
-
5
-
6
-
7
-
8
-
9
-
10
-
11
-
12
-
13
-
14
-
15
-
16
-
17
-
18
-
19
-
20
-
21
-
22
-
23
-
24
-
25
-
26
-
27
-
28
-
29
-
30
-
31
-
32
-
33
-
34
-
35
-
36
-
37
-
38
-
39
-
40
-
41
-
42
-
43
-
44
-
45
-
46
-
47
-
48
-
49
-
50
-
51
-
52
-
53
-
54
-
55
-
56
-
57
-
58
-
59
-
60
-
61
-
62
-
63
-
64
-
65
-
66
-
67
-
68
-
69
-
70
-
71
-
72
-
73
-
74
-
75
-
76
-
77
-
78
-
79
-
80
-
81
-
82
-
83
-
84
-
85
-
86
-
87
-
88
-
89
-
90
-
91
-
92
-
93
-
 94
94 -
 95
95 -
 96
96 -
 97
97 -
 98
98 -
 99
99 -
 100
100 -
 101
101 -
 102
102 -
 103
103 -
 104
104 -
 105
105 -
 106
106 -
 107
107 -
 108
108 -
 109
109 -
 110
110 -
 111
111 -
 112
112 -
 113
113 -
 114
114 -
115
-
116
-
117
-
118
-
119
-
120
-
121
-
122
-
123
-
124
-
125
-
126
-
127
-
128
-
129
-
130
-
131
-
132
-
133
-
134
-
135
-
136
-
137
-
138
-
139
-
140
-
141
-
142
-
143
-
144
-
145
-
146
-
147
-
148
-
149
-
150
-
151
-
152
-
153
-
154
-
155
-
156
-
157
-
158
-
159
-
160
-
161
-
162
-
163
-
164
-
165
-
166
-
167
-
168
-
169
-
170
-
171
-
172
-
173
-
174
-
175
-
176
-
177
-
178
-
179
-
180
-
181
-
182
-
183
-
184
-
185
-
186
-
187
-
188
-
189
-
190
-
191
-
192
 |
 |

84
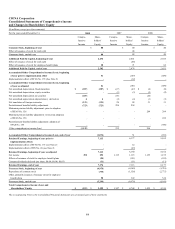
CIGNA Corporation
Consolidated Statements of Comprehensive Income
and Changes in Shareholders’ Equity
(In millions, except per share amounts)
For the years ended December 31, 2008 2007 2006
Compre- Share- Compre- Share- Compre- Share-
hensive holders' hensive holders' hensive holders'
Income Equity Income Equity Income Equity
Common Stock, beginning of year $ 88 $ 40 $ 40
Effect of issuance of stock for stock split - 48 -
Common Stock, end of year 88 88 40
Additional Paid-In Capital, beginning of year 2,474 2,451 2,385
Effect of issuance of stock for stock split - (48) -
Effect of issuance of stock for employee benefit plans 28 71 66
Additional Paid-In Capital, end of year 2,502 2,474 2,451
Accumulated Other Comprehensive Income (Loss), beginning
of year prior to implementation effect 51 (169) (509)
Implementation effect of SFAS No. 155 (See Note 2) - (12) -
Accumulated Other Comprehensive Income (Loss), beginning
of year as adjusted 51 (181) (509)
Net unrealized depreciation, fixed maturities $ (287) (287) $ (47) (47) $ (8) (8)
Net unrealized depreciation, equity securities - - (3) (3) (2) (2)
Net unrealized depreciation on securities (287) (50) (10)
Net unrealized appreciation (depreciation), derivatives 6 6 (4) (4) (1) (1)
Net translation of foreign currencies (121) (121) 28 28 31 31
Postretirement benefits liability adjustment (723) (723) 258 258 - -
Minimum pension liability adjustment: prior to adoption
of SFAS No. 158 - - - - 284 284
Minimum pension liability adjustment: reversal on adoption
of SFAS No. 158 - - - - - 432
Postretirement benefits liability adjustment: adoption of
SFAS No. 158 - - - - - (396)
Other comprehensive income (loss) (1,125) 232 304
Accumulated Other Comprehensive Income (Loss), end of year (1,074) 51 (169)
Retained Earnings, beginning of year prior to 7,113 6,177 5,162
implementation effects
Implementation effect of SFAS No. 155 (see Note 2) - 12 -
Implementation effect of FIN No. 48 (see Note 2) - (29) -
Retained Earnings, beginning of year as adjusted 7,113 6,160 5,162
Net income 292 292 1,115 1,115 1,155 1,155
Effects of issuance of stock for employee benefit plans (20) (151) (129)
Common dividends declared (per share: $0.04; $0.04; $0.03) (11) (11) (11)
Retained Earnings, end of year 7,374 7,113 6,177
Treasury Stock, beginning of year (4,978) (4,169) (1,718)
Repurchase of common stock (378) (1,158) (2,775)
Other, primarily issuance of treasury stock for employee
benefit plans 58 349 324
Treasury Stock, end of year (5,298) (4,978) (4,169)
Total Comprehensive Income (Loss) and
Shareholders’ Equity $ (833) $ 3,592 $ 1,347 $ 4,748 $ 1,459 $ 4,330
The accompanying Notes to the Consolidated Financial Statements are an integral part of these statements.