Cigna 2008 Annual Report Download - page 152
Download and view the complete annual report
Please find page 152 of the 2008 Cigna annual report below. You can navigate through the pages in the report by either clicking on the pages listed below, or by using the keyword search tool below to find specific information within the annual report.-
 1
1 -
2
-
3
-
4
-
5
-
6
-
7
-
8
-
9
-
10
-
11
-
12
-
13
-
14
-
15
-
16
-
17
-
18
-
19
-
20
-
21
-
22
-
23
-
24
-
25
-
26
-
27
-
28
-
29
-
30
-
31
-
32
-
33
-
34
-
35
-
36
-
37
-
38
-
39
-
40
-
41
-
42
-
43
-
44
-
45
-
46
-
47
-
48
-
49
-
50
-
51
-
52
-
53
-
54
-
55
-
56
-
57
-
58
-
59
-
60
-
61
-
62
-
63
-
64
-
65
-
66
-
67
-
68
-
69
-
70
-
71
-
72
-
73
-
74
-
75
-
76
-
77
-
78
-
79
-
80
-
81
-
82
-
83
-
84
-
85
-
86
-
87
-
88
-
89
-
90
-
91
-
92
-
93
-
94
-
95
-
96
-
97
-
98
-
99
-
100
-
101
-
102
-
103
-
104
-
105
-
106
-
107
-
108
-
109
-
110
-
111
-
112
-
113
-
114
-
115
-
116
-
117
-
118
-
119
-
120
-
121
-
122
-
123
-
124
-
125
-
126
-
127
-
128
-
129
-
130
-
131
-
132
-
133
-
134
-
135
-
136
-
137
-
138
-
139
-
140
-
141
-
 142
142 -
 143
143 -
 144
144 -
 145
145 -
 146
146 -
 147
147 -
 148
148 -
 149
149 -
 150
150 -
 151
151 -
 152
152 -
 153
153 -
 154
154 -
 155
155 -
 156
156 -
 157
157 -
 158
158 -
 159
159 -
 160
160 -
 161
161 -
 162
162 -
163
-
164
-
165
-
166
-
167
-
168
-
169
-
170
-
171
-
172
-
173
-
174
-
175
-
176
-
177
-
178
-
179
-
180
-
181
-
182
-
183
-
184
-
185
-
186
-
187
-
188
-
189
-
190
-
191
-
192
 |
 |

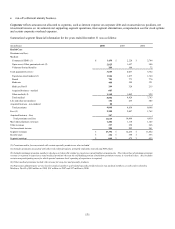
132
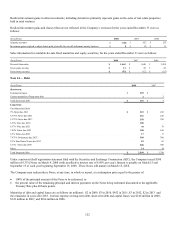
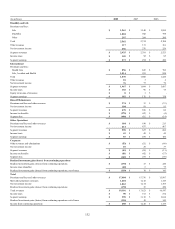
(In millions) 2008 2007 2006
Disability and Life
Premiums and fees:
Life $ 1,261 $ 1,148 $ 1,050
Disability 1,004 942 798
Other 297 284 260
Total 2,562 2,374 2,108
Other revenues 117 131 161
Net investment income 256 276 256
Segment revenues $ 2,935 $ 2,781 $ 2,525
Income taxes $ 109 $ 92 $ 85
Segment earnings $ 273 $ 254 $ 226
International
Premiums and fees:
Health Care $ 856 $ 845 $ 702
Life, Accident and Health 1,014 955 824
Total 1,870 1,800 1,526
Other revenues 18 7 2
Net investment income 79 77 79
Segment revenues $ 1,967 $ 1,884 $ 1,607
Income taxes $ 102 $ 96 $ 75
Equity in income of investees $ 8 $ 3 $ -
Segment earnings $ 182 $ 176 $ 138
Run-off Reinsurance
Premiums and fees and other revenues $ 374 $ 13 $(33)
Net investment income 104 93 95
Segment revenues $ 478 $ 106 $ 62
Income tax benefits $(375) $(43) $(4)
Segment loss $(646) $(11) $(14)
Other Operations
Premiums and fees and other revenues $ 184 $ 190 $ 215
Net investment income 414 437 467
Segment revenues $ 598 $ 627 $ 682
Income taxes $ 43 $ 45 $ 45
Segment earnings $ 87 $ 109 $ 106
Corporate
Other revenues and eliminations $(53) $(55) $(48)
Net investment income 10 29 37
Segment revenues $(43) $(26) $(11)
Income tax benefits $(81) $(42) $(57)
Segment loss $(162) $(97) $(95)
Realized investment gains (losses) from continuing operations
Realized investment gains (losses) from continuing operations $(170) $ 15 $ 220
Income taxes (benefits) (60) 5 75
Realized investment gains (losses) from continuing operations, net of taxes $(110) $ 10 $ 145
Total
Premiums and fees and other revenues $ 17,004 $ 15,376 $ 13,987
Mail order pharmacy revenues 1,204 1,118 1,145
Net investment income 1,063 1,114 1,195
Realized investment gains (losses) from continuing operations (170) 15 220
Total revenues $ 19,101 $ 17,623 $ 16,547
Income taxes $ 90 $ 511 $ 572
Segment earnings $ 398 $ 1,110 $ 1,014
Realized investment gains (losses) from continuing operations, net of taxes (110) 10 145
Income from continuing operations $ 288 $ 1,120 $ 1,159