Cigna 2008 Annual Report Download - page 102
Download and view the complete annual report
Please find page 102 of the 2008 Cigna annual report below. You can navigate through the pages in the report by either clicking on the pages listed below, or by using the keyword search tool below to find specific information within the annual report.-
 1
1 -
2
-
3
-
4
-
5
-
6
-
7
-
8
-
9
-
10
-
11
-
12
-
13
-
14
-
15
-
16
-
17
-
18
-
19
-
20
-
21
-
22
-
23
-
24
-
25
-
26
-
27
-
28
-
29
-
30
-
31
-
32
-
33
-
34
-
35
-
36
-
37
-
38
-
39
-
40
-
41
-
42
-
43
-
44
-
45
-
46
-
47
-
48
-
49
-
50
-
51
-
52
-
53
-
54
-
55
-
56
-
57
-
58
-
59
-
60
-
61
-
62
-
63
-
64
-
65
-
66
-
67
-
68
-
69
-
70
-
71
-
72
-
73
-
74
-
75
-
76
-
77
-
78
-
79
-
80
-
81
-
82
-
83
-
84
-
85
-
86
-
87
-
88
-
89
-
90
-
91
-
 92
92 -
 93
93 -
 94
94 -
 95
95 -
 96
96 -
 97
97 -
 98
98 -
 99
99 -
 100
100 -
 101
101 -
 102
102 -
 103
103 -
 104
104 -
 105
105 -
 106
106 -
 107
107 -
 108
108 -
 109
109 -
 110
110 -
 111
111 -
 112
112 -
113
-
114
-
115
-
116
-
117
-
118
-
119
-
120
-
121
-
122
-
123
-
124
-
125
-
126
-
127
-
128
-
129
-
130
-
131
-
132
-
133
-
134
-
135
-
136
-
137
-
138
-
139
-
140
-
141
-
142
-
143
-
144
-
145
-
146
-
147
-
148
-
149
-
150
-
151
-
152
-
153
-
154
-
155
-
156
-
157
-
158
-
159
-
160
-
161
-
162
-
163
-
164
-
165
-
166
-
167
-
168
-
169
-
170
-
171
-
172
-
173
-
174
-
175
-
176
-
177
-
178
-
179
-
180
-
181
-
182
-
183
-
184
-
185
-
186
-
187
-
188
-
189
-
190
-
191
-
192
 |
 |

82
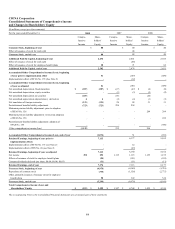
Item 8. FINANCIAL STATEMENTS AND SUPPLEMENTARY DATA
CIGNA Corporation
Consolidated Statements of Income
(In millions, except per share amounts)
For the years ended December 31, 2008 2007 2006
Revenues
Premiums and fees $ 16,203 $ 15,008 $ 13,641
Net investment income 1,063 1,114 1,195
Mail order pharmacy revenues 1,204 1,118 1,145
Other revenues 801 368 346
Realized investment gains (losses) (170) 15 220
Total revenues 19,101 17,623 16,547
Benefits and Expenses
Health Care medical claims expense 7,252 6,798 6,111
Other benefit expenses 4,285 3,401 3,153
Mail order pharmacy cost of goods sold 961 904 922
Guaranteed minimum income benefits expense 690 147 7
Other operating expenses 5,535 4,742 4,623
Total benefits and expenses 18,723 15,992 14,816
Income from Continuing Operations before Income Taxes 378 1,631 1,731
Income taxes (benefits):
Current 311 511 595
Deferred (221) - (23)
Total taxes 90 511 572
Income from Continuing Operations 288 1,120 1,159
Income (Loss) from Discontinued Operations, Net of Taxes 4 (5) (4)
Net Income $ 292 $ 1,115 $ 1,155
Basic Earnings Per Share:
Income from continuing operations $ 1.05 $ 3.95 $ 3.50
Income (loss) from discontinued operations 0.01 (0.01) (0.01)
Net income $ 1.06 $ 3.94 $ 3.49
Diluted Earnings Per Share:
Income from continuing operations $ 1.04 $ 3.88 $ 3.44
Income (loss) from discontinued operations 0.01 (0.01) (0.01)
Net income $ 1.05 $ 3.87 $ 3.43
The accompanying Notes to the Consolidated Financial Statements are an integral part of these statements.