Cigna 2008 Annual Report Download - page 76
Download and view the complete annual report
Please find page 76 of the 2008 Cigna annual report below. You can navigate through the pages in the report by either clicking on the pages listed below, or by using the keyword search tool below to find specific information within the annual report.-
 1
1 -
2
-
3
-
4
-
5
-
6
-
7
-
8
-
9
-
10
-
11
-
12
-
13
-
14
-
15
-
16
-
17
-
18
-
19
-
20
-
21
-
22
-
23
-
24
-
25
-
26
-
27
-
28
-
29
-
30
-
31
-
32
-
33
-
34
-
35
-
36
-
37
-
38
-
39
-
40
-
41
-
42
-
43
-
44
-
45
-
46
-
47
-
48
-
49
-
50
-
51
-
52
-
53
-
54
-
55
-
56
-
57
-
58
-
59
-
60
-
61
-
62
-
63
-
64
-
65
-
 66
66 -
 67
67 -
 68
68 -
 69
69 -
 70
70 -
 71
71 -
 72
72 -
 73
73 -
 74
74 -
 75
75 -
 76
76 -
 77
77 -
 78
78 -
 79
79 -
 80
80 -
 81
81 -
 82
82 -
 83
83 -
 84
84 -
 85
85 -
 86
86 -
87
-
88
-
89
-
90
-
91
-
92
-
93
-
94
-
95
-
96
-
97
-
98
-
99
-
100
-
101
-
102
-
103
-
104
-
105
-
106
-
107
-
108
-
109
-
110
-
111
-
112
-
113
-
114
-
115
-
116
-
117
-
118
-
119
-
120
-
121
-
122
-
123
-
124
-
125
-
126
-
127
-
128
-
129
-
130
-
131
-
132
-
133
-
134
-
135
-
136
-
137
-
138
-
139
-
140
-
141
-
142
-
143
-
144
-
145
-
146
-
147
-
148
-
149
-
150
-
151
-
152
-
153
-
154
-
155
-
156
-
157
-
158
-
159
-
160
-
161
-
162
-
163
-
164
-
165
-
166
-
167
-
168
-
169
-
170
-
171
-
172
-
173
-
174
-
175
-
176
-
177
-
178
-
179
-
180
-
181
-
182
-
183
-
184
-
185
-
186
-
187
-
188
-
189
-
190
-
191
-
192
 |
 |

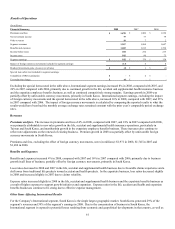
56
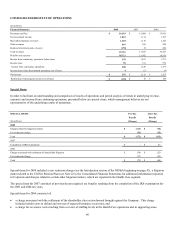
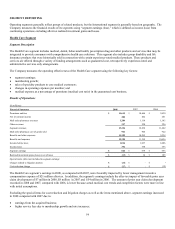
Premiums and fees increased by 9% in 2008, compared with 2007, primarily reflecting:
• the impact of the acquired business;
• increases in the experience-rated business due to rate increases;
• higher other medical premiums due to increased sales to core medical customers and rate increases in specialty business; and
• higher service fees due to increased membership and rate increases.
These factors were partially offset by a decrease in the guaranteed cost business which was due to membership declines largely in
commercial HMO business partially offset by rate increases.
Premiums and fees increased 9% in 2007, compared with 2006, primarily reflecting:
• strong renewal pricing on existing business, particularly in the guaranteed cost business;
• higher Medicare Part D premiums of $111 million;
• growth in specialty revenues; and
• aggregate medical membership growth, including the voluntary/limited benefits business.
In addition, premiums and fees in 2007 reflect a change in the mix of products to more service-only products from guaranteed cost
products.
Net investment income decreased by 1% in 2008 compared with 2007 reflecting lower yields partially offset by higher average assets.
Net investment income decreased by 23% in 2007 compared with 2006 reflecting primarily lower average assets and to a lesser extent
lower yields.
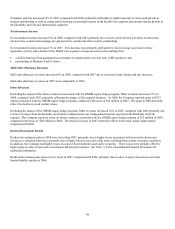
Other revenues for the Health Care segment consist of revenues earned on direct channel sales of certain specialty products, including
behavioral health and disease management.
Other revenues increased 27% in 2008 and 11% in 2007. In 2008, the increase primarily reflected the impact of the acquired business,
while the increase in 2007 was primarily due to business growth.
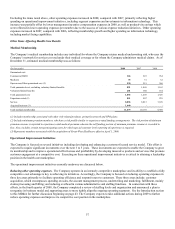
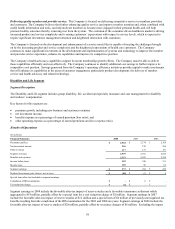
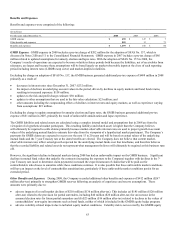
Benefits and Expenses
Health Care segment benefits and expenses consist of the following:
(In millions) 2008 2007 2006
Medical claims expense $ 7,252 $ 6,798 $ 6,111
Other benefit expenses 193 225 260
Mail order pharmacy cost of goods sold 961 904 922
Other operating expenses 3,914 3,272 3,163
Total benefits and expenses $ 12,320 $ 11,199 $ 10,456
Medical claims expense included favorable prior year claim development of approximately $11 million in 2008, $12 million in 2007
and $83 million in 2006. Medical claims expense increased 7% in 2008 compared with 2007 largely due to the impact of the acquired
business. In addition, medical trend was largely offset by lower risk membership. Excluding the prior year claim development,
medical claims expense increased 10% in 2007 compared with 2006 primarily due to medical trend, increased Medicare Part D
membership and the impact of the Star HRG operations.
Other operating expenses include expenses related to:
• integration and operating costs associated with the acquired business;
• both retail and mail order pharmacy;
• disease management;
• voluntary and limited benefits; and
• Medicare claims administration businesses.