Cigna 2008 Annual Report Download - page 135
Download and view the complete annual report
Please find page 135 of the 2008 Cigna annual report below. You can navigate through the pages in the report by either clicking on the pages listed below, or by using the keyword search tool below to find specific information within the annual report.-
 1
1 -
2
-
3
-
4
-
5
-
6
-
7
-
8
-
9
-
10
-
11
-
12
-
13
-
14
-
15
-
16
-
17
-
18
-
19
-
20
-
21
-
22
-
23
-
24
-
25
-
26
-
27
-
28
-
29
-
30
-
31
-
32
-
33
-
34
-
35
-
36
-
37
-
38
-
39
-
40
-
41
-
42
-
43
-
44
-
45
-
46
-
47
-
48
-
49
-
50
-
51
-
52
-
53
-
54
-
55
-
56
-
57
-
58
-
59
-
60
-
61
-
62
-
63
-
64
-
65
-
66
-
67
-
68
-
69
-
70
-
71
-
72
-
73
-
74
-
75
-
76
-
77
-
78
-
79
-
80
-
81
-
82
-
83
-
84
-
85
-
86
-
87
-
88
-
89
-
90
-
91
-
92
-
93
-
94
-
95
-
96
-
97
-
98
-
99
-
100
-
101
-
102
-
103
-
104
-
105
-
106
-
107
-
108
-
109
-
110
-
111
-
112
-
113
-
114
-
115
-
116
-
117
-
118
-
119
-
120
-
121
-
122
-
123
-
124
-
 125
125 -
 126
126 -
 127
127 -
 128
128 -
 129
129 -
 130
130 -
 131
131 -
 132
132 -
 133
133 -
 134
134 -
 135
135 -
 136
136 -
 137
137 -
 138
138 -
 139
139 -
 140
140 -
 141
141 -
 142
142 -
 143
143 -
 144
144 -
 145
145 -
146
-
147
-
148
-
149
-
150
-
151
-
152
-
153
-
154
-
155
-
156
-
157
-
158
-
159
-
160
-
161
-
162
-
163
-
164
-
165
-
166
-
167
-
168
-
169
-
170
-
171
-
172
-
173
-
174
-
175
-
176
-
177
-
178
-
179
-
180
-
181
-
182
-
183
-
184
-
185
-
186
-
187
-
188
-
189
-
190
-
191
-
192
 |
 |

115
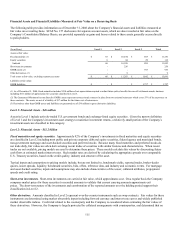
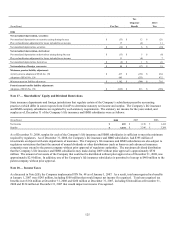
Separate account assets classified in Level 3 include investments primarily in securities partnerships and real estate generally valued at
transaction price in the absence of market data indicating a change in the estimated fair value. Values may be adjusted when evidence
is available to support such adjustments. Evidence may include market data as well as changes in the financial results and condition
of the investment.
The following table summarizes the change in separate account assets reported in Level 3 for the year ended December 31, 2008.
(In millions)
Balance at 1/1/08 $ 403
Policyholder gains (1) 11
Purchases, issuances, settlements 78
Transfers out of Level 3 (17)
Balance at 12/31/08 $ 475
(1) Included in this amount are losses of $4 million attributable to instruments still held at the reporting date.
Assets and Liabilities Measured at Fair Value on a Non-recurring Basis
Certain financial assets and liabilities are measured at fair value on a non-recurring basis, such as commercial mortgage loans held for
sale. As of December 31, 2008, the amount required to adjust these assets and liabilities to their fair value was not significant.
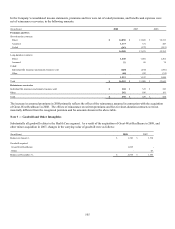
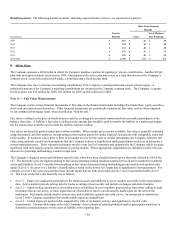
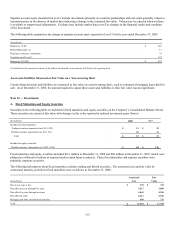
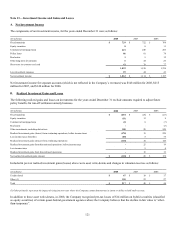
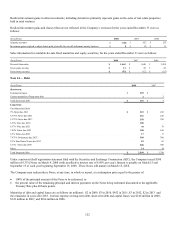
Note 12 — Investments
A. Fixed Maturities and Equity Securities
Securities in the following table are included in fixed maturities and equity securities on the Company’s Consolidated Balance Sheets.
These securities are carried at fair value with changes in fair value reported in realized investment gains (losses).
(In millions) 2008 2007
Included in fixed maturities:
Trading securities (amortized cost: $13; $22) $ 13 $ 22
Hybrid securities (amortized cost: $10; $11) 10 11
Total $ 23 $ 33
Included in equity securities:
Hybrid securities (amortized cost: $123; $114) $ 84 $ 110
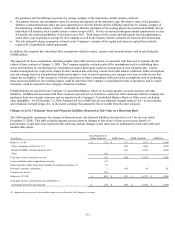
Fixed maturities and equity securities included $211 million at December 31, 2008 and $89 million at December 31, 2007, which were
pledged as collateral to brokers as required under certain futures contracts. These fixed maturities and equities securities were
primarily corporate securities.
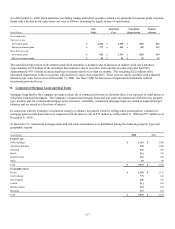
The following information about fixed maturities excludes trading and hybrid securities. The amortized cost and fair value by
contractual maturity periods for fixed maturities were as follows at December 31, 2008:
Amortized Fair
(In millions) Cost Value
Due in one year or less $ 730 $ 734
Due after one year through five years 3,017 3,009
Due after five years through ten years 4,465 4,306
Due after ten years 2,617 2,978
Mortgage and other asset-backed securities 640 731
Total $ 11,469 $ 11,758