Cigna 2008 Annual Report Download - page 81
Download and view the complete annual report
Please find page 81 of the 2008 Cigna annual report below. You can navigate through the pages in the report by either clicking on the pages listed below, or by using the keyword search tool below to find specific information within the annual report.-
 1
1 -
2
-
3
-
4
-
5
-
6
-
7
-
8
-
9
-
10
-
11
-
12
-
13
-
14
-
15
-
16
-
17
-
18
-
19
-
20
-
21
-
22
-
23
-
24
-
25
-
26
-
27
-
28
-
29
-
30
-
31
-
32
-
33
-
34
-
35
-
36
-
37
-
38
-
39
-
40
-
41
-
42
-
43
-
44
-
45
-
46
-
47
-
48
-
49
-
50
-
51
-
52
-
53
-
54
-
55
-
56
-
57
-
58
-
59
-
60
-
61
-
62
-
63
-
64
-
65
-
66
-
67
-
68
-
69
-
70
-
 71
71 -
 72
72 -
 73
73 -
 74
74 -
 75
75 -
 76
76 -
 77
77 -
 78
78 -
 79
79 -
 80
80 -
 81
81 -
 82
82 -
 83
83 -
 84
84 -
 85
85 -
 86
86 -
 87
87 -
 88
88 -
 89
89 -
 90
90 -
 91
91 -
92
-
93
-
94
-
95
-
96
-
97
-
98
-
99
-
100
-
101
-
102
-
103
-
104
-
105
-
106
-
107
-
108
-
109
-
110
-
111
-
112
-
113
-
114
-
115
-
116
-
117
-
118
-
119
-
120
-
121
-
122
-
123
-
124
-
125
-
126
-
127
-
128
-
129
-
130
-
131
-
132
-
133
-
134
-
135
-
136
-
137
-
138
-
139
-
140
-
141
-
142
-
143
-
144
-
145
-
146
-
147
-
148
-
149
-
150
-
151
-
152
-
153
-
154
-
155
-
156
-
157
-
158
-
159
-
160
-
161
-
162
-
163
-
164
-
165
-
166
-
167
-
168
-
169
-
170
-
171
-
172
-
173
-
174
-
175
-
176
-
177
-
178
-
179
-
180
-
181
-
182
-
183
-
184
-
185
-
186
-
187
-
188
-
189
-
190
-
191
-
192
 |
 |

61
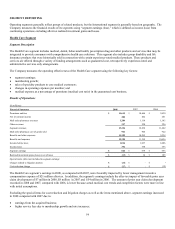
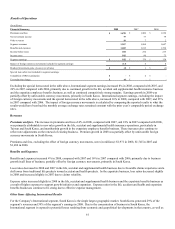
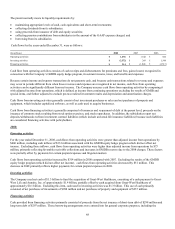
Results of Operations
(In millions)
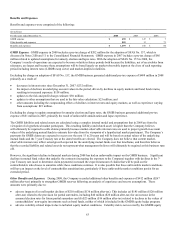
Financial Summary 2008 2007 2006
Premiums and fees $ 1,870 $ 1,800 $ 1,526
Net investment income 79 77 79
Other revenues 18 7 2
Segment revenues 1,967 1,884 1,607
Benefits and expenses 1,683 1,612 1,394
Income before taxes 284 272 213
Income taxes 102 96 75
Segment earnings $ 182 $ 176 $ 138
Impact of foreign currency movements included in segment earnings (13) 4 4
Realized investment gains (losses), net of taxes $ (3) $ 1 $ (1)
Special item (after-tax) included in segment earnings:
Completion of IRS examination $ - $ 2 $ -
Cost reduction charge $ (6) $ - $ -
Excluding the special items noted in the table above, International segment earnings increased 8% in 2008, compared with 2007, and
26% in 2007 compared with 2006, primarily due to continued growth in the life, accident and supplemental health insurance business
and the expatriate employee benefits business, as well as continued competitively strong margins. Earnings growth in 2008 was
partially offset by unfavorable currency movements, primarily in South Korea. International segment earnings, excluding the impact
of foreign currency movements and the special items noted in the table above, increased 16% in 2008, compared with 2007, and 23%
in 2007 compared with 2006. The impact of foreign currency movements is calculated by comparing the reported results to what the
results would have been had the monthly average exchange rates remained constant with the prior year’s comparable period exchange
rates.
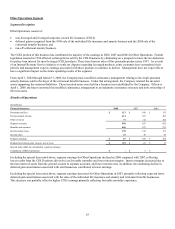
Revenues
Premiums and fees. The increase in premiums and fees of 4% in 2008, compared with 2007, and 18% in 2007 compared with 2006,
was primarily attributable to new sales growth in the life, accident and supplemental health insurance operations, particularly in
Taiwan and South Korea, and membership growth in the expatriate employee benefits business. These increases also continue to
reflect rate adjustments on the renewal of existing business. Premium growth in 2008 was partially offset by unfavorable foreign
currency movements in South Korea.
Premiums and fees, excluding the effect of foreign currency movements, were (in millions): $1,971 in 2008, $1,745 in 2007 and
$1,494 in 2006.
Benefits and Expenses
Benefits and expenses increased 4% in 2008, compared with 2007 and 16% in 2007 compared with 2006, primarily due to business
growth in all lines of business, partially offset by foreign currency movements, primarily in South Korea.
Loss ratios decreased in 2008 and 2007 in the life, accident and supplemental health business due to favorable claims experience and a
shift away from traditional life products toward accident and health products. In the expatriate business, loss ratios decreased slightly
in 2008 and increased slightly in 2007 due to claims volatility.
Expense ratios increased slightly in 2008 in the life, accident and supplemental health business and the expatriate benefits business as
a result of higher expenses to support growth initiatives and expansion. Expense ratios in the life, accident and health and expatriate
benefits businesses continue to be strong due to effective expense management.
Other Items Affecting International Results
For the Company’s International segment, South Korea is the single largest geographic market. South Korea generated 29% of the
segment’s revenues and 39% of the segment’s earnings in 2008. Due to the concentration of business in South Korea, the
International segment is exposed to potential losses resulting from economic and geopolitical developments in that country, as well as