Cigna 2008 Annual Report Download - page 80
Download and view the complete annual report
Please find page 80 of the 2008 Cigna annual report below. You can navigate through the pages in the report by either clicking on the pages listed below, or by using the keyword search tool below to find specific information within the annual report.-
 1
1 -
2
-
3
-
4
-
5
-
6
-
7
-
8
-
9
-
10
-
11
-
12
-
13
-
14
-
15
-
16
-
17
-
18
-
19
-
20
-
21
-
22
-
23
-
24
-
25
-
26
-
27
-
28
-
29
-
30
-
31
-
32
-
33
-
34
-
35
-
36
-
37
-
38
-
39
-
40
-
41
-
42
-
43
-
44
-
45
-
46
-
47
-
48
-
49
-
50
-
51
-
52
-
53
-
54
-
55
-
56
-
57
-
58
-
59
-
60
-
61
-
62
-
63
-
64
-
65
-
66
-
67
-
68
-
69
-
 70
70 -
 71
71 -
 72
72 -
 73
73 -
 74
74 -
 75
75 -
 76
76 -
 77
77 -
 78
78 -
 79
79 -
 80
80 -
 81
81 -
 82
82 -
 83
83 -
 84
84 -
 85
85 -
 86
86 -
 87
87 -
 88
88 -
 89
89 -
 90
90 -
91
-
92
-
93
-
94
-
95
-
96
-
97
-
98
-
99
-
100
-
101
-
102
-
103
-
104
-
105
-
106
-
107
-
108
-
109
-
110
-
111
-
112
-
113
-
114
-
115
-
116
-
117
-
118
-
119
-
120
-
121
-
122
-
123
-
124
-
125
-
126
-
127
-
128
-
129
-
130
-
131
-
132
-
133
-
134
-
135
-
136
-
137
-
138
-
139
-
140
-
141
-
142
-
143
-
144
-
145
-
146
-
147
-
148
-
149
-
150
-
151
-
152
-
153
-
154
-
155
-
156
-
157
-
158
-
159
-
160
-
161
-
162
-
163
-
164
-
165
-
166
-
167
-
168
-
169
-
170
-
171
-
172
-
173
-
174
-
175
-
176
-
177
-
178
-
179
-
180
-
181
-
182
-
183
-
184
-
185
-
186
-
187
-
188
-
189
-
190
-
191
-
192
 |
 |

60
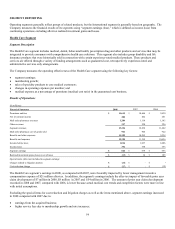
of the items noted above, segment earnings increased 8% in 2008, compared with 2007 reflecting:
• favorable claims experience in the disability insurance business driven by strong disability claims management;
• favorable claims experience in the specialty insurance business;
• a lower expense ratio driven by effective operating expense management and lower management incentive compensation; and
• higher premiums and fees in the disability, life and accident businesses due to business growth.
These factors were partially offset by less favorable claims experience in the life and accident businesses and lower net investment
income primarily due to lower average yields.
Excluding the impact of reserve studies and the items noted above, segment earnings increased 16% in 2007, compared with 2006
reflecting:
• continued strong disability claims management results;
• higher net investment income due to higher average assets and yields;
• favorable claims experience in the accident, group universal life and specialty businesses;
• a lower expense ratio driven by effective operating expense management; and
• strong earned premium growth.
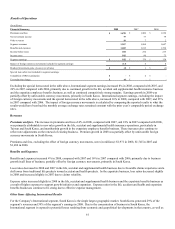
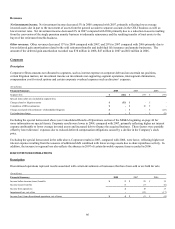
Revenues
Premiums and fees increased 8% in 2008 and 13% in 2007 reflecting new sales growth in the disability, life and accident lines of
business and strong customer retention.
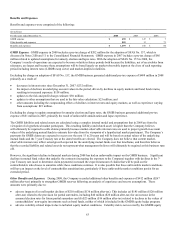
Benefits and Expenses
Excluding the pre-tax impact of the reserve studies, reinsurance settlement and cost reduction charge noted above, benefits and
expenses increased 5% in 2008 compared with 2007, reflecting overall business growth, partially offset by favorable claims
experience in the disability and specialty businesses tempered by less favorable claims experience in the life and accident businesses.
In addition, lower expenses were driven by continued focus on operating expense management, lower disability and workers’
compensation case management expenses and lower management incentive compensation expenses.
Excluding the pre-tax impact of the reserve studies and severance charge noted above, benefits and expenses increased 9% in 2007
compared with 2006, reflecting overall business growth, continued strong disability claims management and unfavorable life claims
experience largely offset by favorable accident and specialty claims experience. In addition, lower expenses were driven by continued
focus on operating expense management and lower disability and workers’ compensation case management expenses.
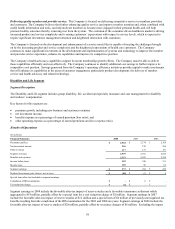
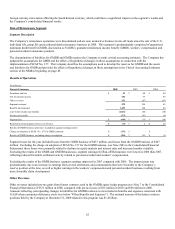
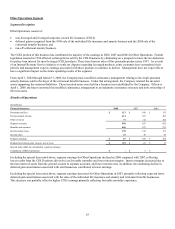
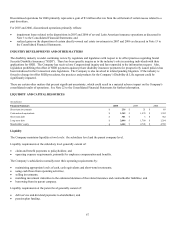
International Segment
Segment Description
The International segment includes life, accident and supplemental health insurance products and international health care products
and services, including those offered to expatriate employees of multinational corporations.
The key factors for this segment are:
• premium growth, including new business and customer retention;
• benefits expense as a percentage of earned premium (loss ratio); and
• operating expense as a percentage of earned premium (expense ratio).