Cigna 2008 Annual Report Download - page 173
Download and view the complete annual report
Please find page 173 of the 2008 Cigna annual report below. You can navigate through the pages in the report by either clicking on the pages listed below, or by using the keyword search tool below to find specific information within the annual report.-
 1
1 -
2
-
3
-
4
-
5
-
6
-
7
-
8
-
9
-
10
-
11
-
12
-
13
-
14
-
15
-
16
-
17
-
18
-
19
-
20
-
21
-
22
-
23
-
24
-
25
-
26
-
27
-
28
-
29
-
30
-
31
-
32
-
33
-
34
-
35
-
36
-
37
-
38
-
39
-
40
-
41
-
42
-
43
-
44
-
45
-
46
-
47
-
48
-
49
-
50
-
51
-
52
-
53
-
54
-
55
-
56
-
57
-
58
-
59
-
60
-
61
-
62
-
63
-
64
-
65
-
66
-
67
-
68
-
69
-
70
-
71
-
72
-
73
-
74
-
75
-
76
-
77
-
78
-
79
-
80
-
81
-
82
-
83
-
84
-
85
-
86
-
87
-
88
-
89
-
90
-
91
-
92
-
93
-
94
-
95
-
96
-
97
-
98
-
99
-
100
-
101
-
102
-
103
-
104
-
105
-
106
-
107
-
108
-
109
-
110
-
111
-
112
-
113
-
114
-
115
-
116
-
117
-
118
-
119
-
120
-
121
-
122
-
123
-
124
-
125
-
126
-
127
-
128
-
129
-
130
-
131
-
132
-
133
-
134
-
135
-
136
-
137
-
138
-
139
-
140
-
141
-
142
-
143
-
144
-
145
-
146
-
147
-
148
-
149
-
150
-
151
-
152
-
153
-
154
-
155
-
156
-
157
-
158
-
159
-
160
-
161
-
162
-
 163
163 -
 164
164 -
 165
165 -
 166
166 -
 167
167 -
 168
168 -
 169
169 -
 170
170 -
 171
171 -
 172
172 -
 173
173 -
 174
174 -
 175
175 -
 176
176 -
 177
177 -
 178
178 -
 179
179 -
 180
180 -
 181
181 -
 182
182 -
 183
183 -
184
-
185
-
186
-
187
-
188
-
189
-
190
-
191
-
192
 |
 |

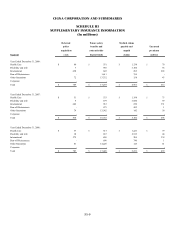
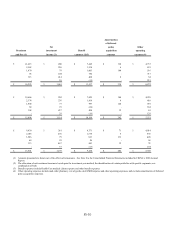
FS-10
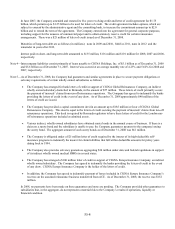
Amortization
of deferred
Net policy Other
Premiums investment Benefit acquisition operating
and fees (1) income (2) expenses (1)(3) expenses expenses (4)
$ 11,615 $ 200 $ 7,445 $ 138 $ 4,737
2,562 256 1,914 6 633
1,870 79 1,003 164 516
43 104 782 - 717
113 414 408 6 54
- 10 (15) - 215
$ 16,203 $ 1,063 $ 11,537 $ 314 $ 6,872
$ 10,666 $ 202 $ 7,023 $ 100 $ 4,076
2,374 276 1,819 6 610
1,800 77 997 124 491
60 93 (24) - 184
108 437 400 12 61
- 29 (16) - 129
$ 15,008 $ 1,114 $ 10,199 $ 242 $ 5,551
$ 9,830 $ 261 $ 6,371 $ 71 $ 4,014
2,108 256 1,578 6 630
1,526 79 861
113 420
64 95 26 - 54
113 467 441 12 78
- 37 (13) - 154
$ 13,641 $ 1,195 $ 9,264 $ 202 $ 5,350
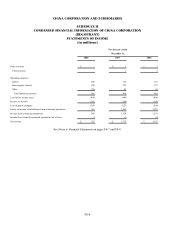
(1) Amounts presented are shown net of the effects of reinsurance. See Note 8 to the Consolidated Financial Statements included in CIGNA’s 2008 Annual
Report.
(2) The allocation of net investment income is based upon the investment year method, the identification of certain portfolios with specific segments, or a
combination of both.
(3) Benefit expenses include Health Care medical claims expense and other benefit expenses.
(4) Other operating expenses include mail order pharmacy cost of goods sold, GMIB expense and other operating expenses, and excludes amortization of deferred
policy acquisition expenses.