Cigna 2008 Annual Report Download - page 149
Download and view the complete annual report
Please find page 149 of the 2008 Cigna annual report below. You can navigate through the pages in the report by either clicking on the pages listed below, or by using the keyword search tool below to find specific information within the annual report.-
 1
1 -
2
-
3
-
4
-
5
-
6
-
7
-
8
-
9
-
10
-
11
-
12
-
13
-
14
-
15
-
16
-
17
-
18
-
19
-
20
-
21
-
22
-
23
-
24
-
25
-
26
-
27
-
28
-
29
-
30
-
31
-
32
-
33
-
34
-
35
-
36
-
37
-
38
-
39
-
40
-
41
-
42
-
43
-
44
-
45
-
46
-
47
-
48
-
49
-
50
-
51
-
52
-
53
-
54
-
55
-
56
-
57
-
58
-
59
-
60
-
61
-
62
-
63
-
64
-
65
-
66
-
67
-
68
-
69
-
70
-
71
-
72
-
73
-
74
-
75
-
76
-
77
-
78
-
79
-
80
-
81
-
82
-
83
-
84
-
85
-
86
-
87
-
88
-
89
-
90
-
91
-
92
-
93
-
94
-
95
-
96
-
97
-
98
-
99
-
100
-
101
-
102
-
103
-
104
-
105
-
106
-
107
-
108
-
109
-
110
-
111
-
112
-
113
-
114
-
115
-
116
-
117
-
118
-
119
-
120
-
121
-
122
-
123
-
124
-
125
-
126
-
127
-
128
-
129
-
130
-
131
-
132
-
133
-
134
-
135
-
136
-
137
-
138
-
 139
139 -
 140
140 -
 141
141 -
 142
142 -
 143
143 -
 144
144 -
 145
145 -
 146
146 -
 147
147 -
 148
148 -
 149
149 -
 150
150 -
 151
151 -
 152
152 -
 153
153 -
 154
154 -
 155
155 -
 156
156 -
 157
157 -
 158
158 -
 159
159 -
160
-
161
-
162
-
163
-
164
-
165
-
166
-
167
-
168
-
169
-
170
-
171
-
172
-
173
-
174
-
175
-
176
-
177
-
178
-
179
-
180
-
181
-
182
-
183
-
184
-
185
-
186
-
187
-
188
-
189
-
190
-
191
-
192
 |
 |

129
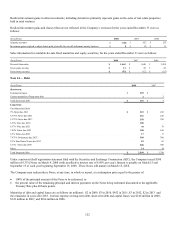
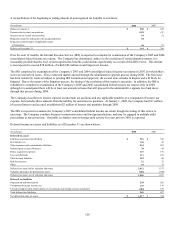
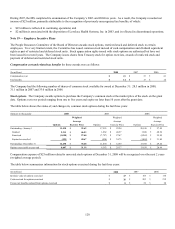
The following table summarizes information for outstanding common stock options at December 31, 2008:
(In millions, except options in Options Options
thousands) Outstanding Exercisable
Number 12,258 8,687
Total intrinsic value $ 1 $ 1
Weighted average exercise price $ 35.48 $ 31.19
Weighted average remaining
contractual life (years) 5.3 years 3.9 years
The weighted average fair value of options granted under employee incentive plans was $14.33 for 2008, $16.05 for 2007 and $14.57
for 2006, using the Black-Scholes option-pricing model and the following assumptions:
2008 2007 2006
Dividend yield 0.1% 0.1% 0.1%
Expected volatility 35.0% 35.0% 35.0%
Risk-free interest rate 2.2% 4.7% 4.6%
Expected option life 4 years 4 years 4.5 years
The expected volatility reflects the Company’s past daily stock price volatility. The Company does not consider volatility implied in
the market prices of traded options to be a good indicator of future volatility because remaining maturities of traded options are less
than one year. In 2008 and 2007, the expected option life reflects the Company’s historical experience excluding activity related to
options granted under a replacement option feature. Prior to 2007, the Company developed the expected option life by considering
certain factors, including assumptions used by other companies with comparable stock option plan features and the Company’s
cancellation of a replacement option feature in June 2004.
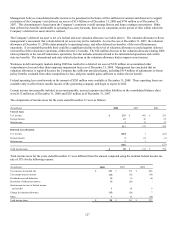
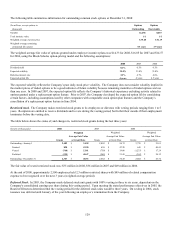
Restricted stock. The Company makes restricted stock grants to its employees or directors with vesting periods ranging from 1 to 5
years. Recipients are entitled to receive dividends and to vote during the vesting period, but forfeit their awards if their employment
terminates before the vesting date.
The table below shows the status of, and changes in, restricted stock grants during the last three years:
(Grants in thousands) 2008 2007 2006
Weighted Weighted Weighted
Average Fair Value Average Fair Value Average Fair Value
Grants at Grant Date Grants at Grant Date Grants at Grant Date
Outstanding - January 1 2,482 $ 34.28 2,802 $ 26.72 3,759 $ 21.01
Granted 820 $ 43.90 698 $ 47.20 645 $ 40.41
Vested (760) $ 23.81 (750) $ 19.06 (1,233) $ 17.24
Forfeited (195) $ 40.47 (268) $ 31.45 (369) $ 24.13
Outstanding - December 31 2,347 $ 40.53 2,482 $ 34.28 2,802 $ 26.72
The fair value of vested restricted stock was: $35 million in 2008, $36 million in 2007 and $49 million in 2006.
At the end of 2008, approximately 2,500 employees held 2.3 million restricted shares with $49 million of related compensation
expense to be recognized over the next 3 years (weighted average period).
Deferred Stock. In 2003, the Company made deferred stock unit grants with 100% vesting in three to six years, dependent on the
Company's consolidated earnings per share during this vesting period. Upon meeting the stated performance objectives in 2005, the
Board of Directors determined that the vesting period for the deferred stock units would be three years. On vesting in 2006, stock
issuance was deferred until January of the year following an employee’s termination from the Company.