Cigna 2008 Annual Report Download - page 168
Download and view the complete annual report
Please find page 168 of the 2008 Cigna annual report below. You can navigate through the pages in the report by either clicking on the pages listed below, or by using the keyword search tool below to find specific information within the annual report.-
 1
1 -
2
-
3
-
4
-
5
-
6
-
7
-
8
-
9
-
10
-
11
-
12
-
13
-
14
-
15
-
16
-
17
-
18
-
19
-
20
-
21
-
22
-
23
-
24
-
25
-
26
-
27
-
28
-
29
-
30
-
31
-
32
-
33
-
34
-
35
-
36
-
37
-
38
-
39
-
40
-
41
-
42
-
43
-
44
-
45
-
46
-
47
-
48
-
49
-
50
-
51
-
52
-
53
-
54
-
55
-
56
-
57
-
58
-
59
-
60
-
61
-
62
-
63
-
64
-
65
-
66
-
67
-
68
-
69
-
70
-
71
-
72
-
73
-
74
-
75
-
76
-
77
-
78
-
79
-
80
-
81
-
82
-
83
-
84
-
85
-
86
-
87
-
88
-
89
-
90
-
91
-
92
-
93
-
94
-
95
-
96
-
97
-
98
-
99
-
100
-
101
-
102
-
103
-
104
-
105
-
106
-
107
-
108
-
109
-
110
-
111
-
112
-
113
-
114
-
115
-
116
-
117
-
118
-
119
-
120
-
121
-
122
-
123
-
124
-
125
-
126
-
127
-
128
-
129
-
130
-
131
-
132
-
133
-
134
-
135
-
136
-
137
-
138
-
139
-
140
-
141
-
142
-
143
-
144
-
145
-
146
-
147
-
148
-
149
-
150
-
151
-
152
-
153
-
154
-
155
-
156
-
157
-
 158
158 -
 159
159 -
 160
160 -
 161
161 -
 162
162 -
 163
163 -
 164
164 -
 165
165 -
 166
166 -
 167
167 -
 168
168 -
 169
169 -
 170
170 -
 171
171 -
 172
172 -
 173
173 -
 174
174 -
 175
175 -
 176
176 -
 177
177 -
 178
178 -
179
-
180
-
181
-
182
-
183
-
184
-
185
-
186
-
187
-
188
-
189
-
190
-
191
-
192
 |
 |

FS-5
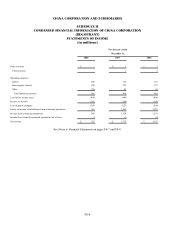
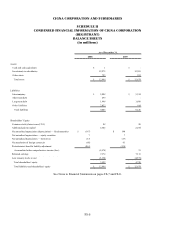
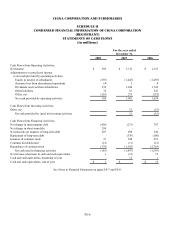
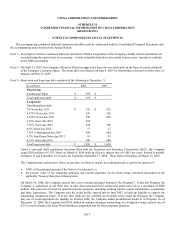
CIGNA CORPORATION AND SUBSIDIARIES
SCHEDULE II
CONDENSED FINANCIAL INFORMATION OF CIGNA CORPORATION
(REGISTRANT)
BALANCE SHEETS
(in millions)
As of December 31,
2008 2007
Assets:
Cash and cash equivalents $ 1 $ -
Investments in subsidiaries 12,275 12,581
Other assets 723 293
Total assets $ 12,999 $ 12,874
Liabilities:
Intercompany $ 5,088 $ 5,514
Short-term debt 299 -
Long-term debt 1,998 1,698
Other liabilities 2,022 914
Total liabilities 9,407 8,126
Shareholders' Equity:
Common stock (shares issued, 351) 88 88
Additional paid in capital 2,502 2,474
Net unrealized appreciation (depreciation) — fixed maturities $ (147) $ 140
Net unrealized appreciation — equity securities 7 7
Net unrealized depreciation — derivatives (13) (19)
Net translation of foreign currencies (60) 61
Postretirement benefits liability adjustment (861) (138)
Accumulated other comprehensive income (loss) (1,074) 51
Retained earnings 7,374 7,113
Less treasury stock, at cost (5,298) (4,978)
Total shareholders' equity 3,592 4,748
Total liabilities and shareholders' equity $ 12,999 $ 12,874
See Notes to Financial Statements on pages FS-7 and FS-8.