Albertsons 2003 Annual Report Download - page 70
Download and view the complete annual report
Please find page 70 of the 2003 Albertsons annual report below. You can navigate through the pages in the report by either clicking on the pages listed below, or by using the keyword search tool below to find specific information within the annual report.-
 1
1 -
2
-
3
-
4
-
5
-
6
-
7
-
8
-
9
-
10
-
11
-
12
-
13
-
14
-
15
-
16
-
17
-
18
-
19
-
20
-
21
-
22
-
23
-
24
-
25
-
26
-
27
-
28
-
29
-
30
-
31
-
32
-
33
-
34
-
35
-
36
-
37
-
38
-
39
-
40
-
41
-
42
-
43
-
44
-
45
-
46
-
47
-
48
-
49
-
50
-
51
-
52
-
53
-
54
-
55
-
56
-
57
-
58
-
59
-
 60
60 -
 61
61 -
 62
62 -
 63
63 -
 64
64 -
 65
65 -
 66
66 -
 67
67 -
 68
68 -
 69
69 -
 70
70 -
 71
71 -
 72
72
 |
 |

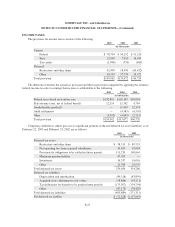
UNAUDITED QUARTERLY FINANCIAL INFORMATION
(In thousands, except per share data)
Unaudited quarterly financial information for SUPERVALU INC. and subsidiaries is as follows:
Fiscal Year Ended February 22, 2003
First
(16 wks)
Second
(12 wks)
Third
(12 wks)
Fourth
(12 wks)
Year
(52 wks)
Net sales $5,654,424 $4,339,579 $4,553,443 $4,612,922 $19,160,368
Gross profit $ 756,956 $ 591,669 $ 596,343 $ 648,003 $ 2,592,971
Net earnings $ 77,155 $ 58,807 $ 57,137 $ 63,943 $ 257,042
Net earnings per common share—diluted $ 0.57 $ 0.44 $ 0.43 $ 0.48 $ 1.91
Dividends declared per common share $ 0.1400 $ 0.1425 $ 0.1425 $ 0.1425 $ 0.5675
Weighted average shares—diluted 136,139 134,927 134,087 133,934 134,877
Fiscal Year Ended February 23, 2002
First
(16 wks)
Second
(12 wks)
Third
(12 wks)
Fourth
(12 wks)
Year
(52 wks)
Net sales $6,742,046 $4,568,770 $4,470,548 $4,511,676 $20,293,040
Gross profit $ 766,916 $ 591,013 $ 591,911 $ 639,003 $ 2,588,843
Net earnings $ 56,968 $ 50,568 $ 58,016 $ 32,774 $ 198,326
Net earnings per common share—diluted $ 0.43 $ 0.38 $ 0.43 $ 0.24 $ 1.48
Dividends declared per common share $ 0.1375 $ 0.1400 $ 0.1400 $ 0.1400 $ 0.5575
Weighted average shares—diluted 132,576 134,249 135,068 134,486 133,978
Note: Fiscal 2003 net earnings include after-tax restructure charges of $1.8 million or $0.01 per diluted
share. Fiscal 2002 net earnings include after-tax restructure and other items of $35.2 million or $0.27 per diluted
share. Commencing with the fourth quarter of fiscal 2003, previously reported net sales and cost of sales have
been revised for all prior periods by reclassifying cost of sales against net sales relating to certain facilitative
services it provided between its independent retailers and vendors related to products typically known as Direct
Store Delivery (DSD) products. This reclassification had no impact on gross profit, earnings before income taxes,
net earnings, cash flows, or financial position for any period or their respective trends. See the Summary of
Significant Accounting Policies for additional information.
F-35