Albertsons 2003 Annual Report Download - page 5
Download and view the complete annual report
Please find page 5 of the 2003 Albertsons annual report below. You can navigate through the pages in the report by either clicking on the pages listed below, or by using the keyword search tool below to find specific information within the annual report.-
 1
1 -
 2
2 -
 3
3 -
 4
4 -
 5
5 -
 6
6 -
 7
7 -
 8
8 -
 9
9 -
 10
10 -
 11
11 -
 12
12 -
 13
13 -
 14
14 -
 15
15 -
 16
16 -
17
-
18
-
19
-
20
-
21
-
22
-
23
-
24
-
25
-
26
-
27
-
28
-
29
-
30
-
31
-
32
-
33
-
34
-
35
-
36
-
37
-
38
-
39
-
40
-
41
-
42
-
43
-
44
-
45
-
46
-
47
-
48
-
49
-
50
-
51
-
52
-
53
-
54
-
55
-
56
-
57
-
58
-
59
-
60
-
61
-
62
-
63
-
64
-
65
-
66
-
67
-
68
-
69
-
70
-
71
-
72
 |
 |

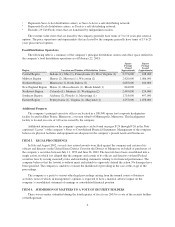
The food distribution business competes directly with a number of food wholesalers. The company believes
it competes in this supply chain on the basis of product price, quality and assortment, schedule and reliability of
deliveries, the range and quality of services provided, service fees, and the location of distribution facilities.
Employees
At February 22, 2003, the company had approximately 57,400 employees. Approximately 23,300
employees are covered by collective bargaining agreements. During fiscal 2003, 10 collective bargaining
agreements covering 4,100 employees were re-negotiated without any work stoppage. In fiscal 2004, 15
collective bargaining agreements covering approximately 6,650 employees will expire. The company believes
that it has generally good relations with its employees.
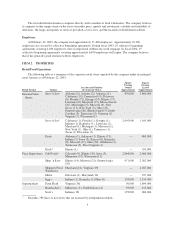
ITEM 2. PROPERTIES
Retail Food Operations
The following table is a summary of the corporate retail stores operated by the company under its principal
retail formats as of February 22, 2003:
Retail Format Banner
Location and Number
of Corporate Stores
Square
Footage
Owned
(Approximate)
Square
Footage
Leased
(Approximate)
ExtremeValue
Stores
Save-A-Lot1Alabama (2), Arizona (2), Arkansas (1),
California (19), Connecticut (5), Delaware
(6), Florida (72), Georgia (14), Illinois (17),
Louisiana (8), Maryland (12), Massachusetts
(10), Mississippi (5), Missouri (8), New
Jersey (11), New York (5), Ohio (31),
Pennsylvania (26), Rhode Island (3), South
Carolina (3), Tennessee (5), Vermont (1),
Virginia (7), Wisconsin (1)
450,000 3,860,000
Save-A-Lot2California (1), Florida (1), Georgia (1),
Indiana (1), Kentucky (1), Louisiana (1),
Maryland (1), Michigan (1), Missouri (1),
New York (1), Ohio (1), Tennessee (1),
Texas (1) Wisconsin (1)
2,495,000 1,169,000
Deals Alabama (1), Arkansas (1), Illinois (13),
Indiana (7), Iowa (3), Kansas (6), Kentucky
(8), Missouri (25), Ohio (20), Oklahoma (3),
Tennessee (5), West Virginia (1)
— 865,000
Deals3Illinois (1) — 510,000
Price Superstores Cub Foods4Colorado (9), Illinois (29), Iowa (3),
Minnesota (31), Wisconsin (11)
2,864,000 2,960,000
Shop ’n Save Illinois (14), Missouri (21), Pennsylvania
(19)
471,000 2,362,000
Shoppers Food
Warehouse
Maryland (24), Virginia (19) — 2,287,000
Metro Delaware (1), Maryland (16) — 937,000
bigg’s Indiana (1), Kentucky (1),Ohio (9) 158,000 1,154,000
Supermarkets Farm Fresh Virginia (36) 30,000 1,694,000
Hornbacher’s Minnesota (1), North Dakota (4) 95,000 113,000
Scott’s Indiana (18) 293,000 680,000
1Excludes 783 Save-A-Lot stores that are licensed by independent retailers.
5