Albertsons 2003 Annual Report Download - page 56
Download and view the complete annual report
Please find page 56 of the 2003 Albertsons annual report below. You can navigate through the pages in the report by either clicking on the pages listed below, or by using the keyword search tool below to find specific information within the annual report.-
 1
1 -
2
-
3
-
4
-
5
-
6
-
7
-
8
-
9
-
10
-
11
-
12
-
13
-
14
-
15
-
16
-
17
-
18
-
19
-
20
-
21
-
22
-
23
-
24
-
25
-
26
-
27
-
28
-
29
-
30
-
31
-
32
-
33
-
34
-
35
-
36
-
37
-
38
-
39
-
40
-
41
-
42
-
43
-
44
-
45
-
 46
46 -
 47
47 -
 48
48 -
 49
49 -
 50
50 -
 51
51 -
 52
52 -
 53
53 -
 54
54 -
 55
55 -
 56
56 -
 57
57 -
 58
58 -
 59
59 -
 60
60 -
 61
61 -
 62
62 -
 63
63 -
 64
64 -
 65
65 -
 66
66 -
67
-
68
-
69
-
70
-
71
-
72
 |
 |

SUPERVALU INC. and Subsidiaries
NOTES TO CONSOLIDATED FINANCIAL STATEMENTS—(Continued)
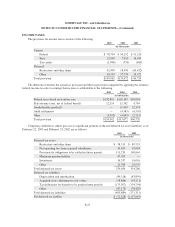
In the following table, the company has adjusted reported net earnings, diluted net earnings per common
share and basic net earnings per common share to exclude amortization expense related to goodwill, that is no
longer being amortized upon the adoption of SFAS No. 142:
(In thousands, except per share data) 2003 2002 2001
Reported net earnings $257,042 $198,326 $ 72,870
Goodwill amortization — 48,363 49,405
Adjusted net earnings $257,042 $246,689 $122,275
Diluted net earnings per common share:
Reported net earnings $ 1.91 $ 1.48 $ 0.55
Goodwill amortization — 0.35 0.37
Adjusted net earnings $ 1.91 $ 1.83 $ 0.92
Basic net earnings per common share:
Reported net earnings $ 1.92 $ 1.49 $ 0.55
Goodwill amortization — 0.35 0.37
Adjusted net earnings $ 1.92 $ 1.84 $ 0.92
The carrying amount of other intangible assets as of February 22, 2003 and February 23, 2002 are as
follows:
Balance
February 22, 2003
Balance
February 23, 2002
(In thousands)
Gross
Carrying
Amount
Accumulated
Amortization
Net
Carrying
Amount
Gross
Carrying
Amount
Accumulated
Amortization
Net
Carrying
Amount
Non-compete agreements $ 8,506 $(4,376) $4,130 $ 8,406 $(3,500) $4,906
Customer lists and other 8,370 (4,313) 4,057 8,180 (3,914) 4,266
Total $16,876 $(8,689) $8,187 $16,586 $(7,414) $9,172
Other intangible assets are presented in the “Other assets” line in the Consolidated Balance Sheets.
Amortization expense of $1.4 million, $1.8 million and $2.4 million was recorded in the fiscal 2003, 2002 and
2001, respectively. Future amortization expense will approximate $1.0 million per year for each of the next five
years. Intangible assets with a definite life are amortized on a straight-line basis with estimated useful lives
ranging from five to ten years.
INVESTMENTS IN UNCONSOLIDATED EQUITY AFFILIATES
The company recognized $39.7 million, $29.2 million and $21.5 million in earnings from investments in
unconsolidated equity affiliates in fiscal 2003, 2002 and 2001, respectively. The equity method of accounting is
used for companies and other investments in which the company has significant influence, which generally
represents common stock ownership or partnership equity of at least 20% and not more than 50%. At year-end
2003, the company’s investment in unconsolidated equity affiliates primarily include a 22% interest in WinCo
Foods and Subsidiaries, the owner and operator of retail supermarkets located in Oregon, Washington, California
and Nevada, a 26% interest in International Data, LLC, a strategic outsourcing services provider, specializing in,
among other things, data services, check and remittance processing and coupon promotions processing and a
40% interest in Tidyman’s, LLC, the owner and operator of retail supermarkets located in Montana, Idaho and
Washington. These investments primarily relate to the retail food segment.
F-21