Albertsons 2003 Annual Report Download - page 11
Download and view the complete annual report
Please find page 11 of the 2003 Albertsons annual report below. You can navigate through the pages in the report by either clicking on the pages listed below, or by using the keyword search tool below to find specific information within the annual report.-
 1
1 -
 2
2 -
 3
3 -
 4
4 -
 5
5 -
 6
6 -
 7
7 -
 8
8 -
 9
9 -
 10
10 -
 11
11 -
 12
12 -
 13
13 -
 14
14 -
 15
15 -
 16
16 -
 17
17 -
 18
18 -
 19
19 -
 20
20 -
 21
21 -
 22
22 -
23
-
24
-
25
-
26
-
27
-
28
-
29
-
30
-
31
-
32
-
33
-
34
-
35
-
36
-
37
-
38
-
39
-
40
-
41
-
42
-
43
-
44
-
45
-
46
-
47
-
48
-
49
-
50
-
51
-
52
-
53
-
54
-
55
-
56
-
57
-
58
-
59
-
60
-
61
-
62
-
63
-
64
-
65
-
66
-
67
-
68
-
69
-
70
-
71
-
72
 |
 |
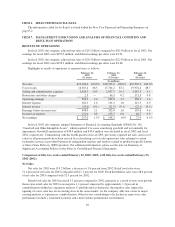
Fiscal 2003 store activity, including licensed units, resulted in 198 new stores opened and acquired,
including the May 2002 acquisition of 50 Deals stores, and 41 stores closed or sold for a total of 1,417 stores at
year end. Total square footage increased approximately 6.6 percent over the prior year.
Food distribution sales for 2003 decreased 13.3 percent compared to 2002, reflecting lost customer sales
including the exit of the Kmart supply contract, which terminated June 30, 2001, the loss of Genuardi’s as a
customer and restructure activities, which accounted for approximately eight percent, three percent and one
percent, respectively, of the decrease in food distribution sales.
Gross Profit
Gross profit (calculated as net sales less cost of sales), as a percentage of net sales, was 13.5 percent for
2003 compared to 12.8 percent for 2002. The increase in gross profit, as a percentage of net sales, reflects the
growing proportion of the company’s retail food business, which operates at a higher gross profit margin as a
percentage of net sales than does the food distribution business, including the higher gross profit margin of the
recently acquired and opened Deals stores. Gross profit in retail benefited from improved merchandising
execution. Gross profit in distribution was negatively impacted by a change in our distribution customer mix.
Selling and Administrative Expenses
Selling and administrative expenses, as a percentage of net sales, were 10.5 percent for 2003 compared to
10.1 percent for 2002. Selling and administrative expenses include $12.5 million in store closing reserves
recorded in the fourth quarter 2002. Fiscal 2002 also includes goodwill amortization of $48.4 million. The
increase in selling and administrative expenses, as a percentage of net sales, reflects the growing proportion of
the company’s retail food business, which operates at a higher selling and administrative expense as a percentage
of net sales than does the food distribution business, including the higher selling and administrative expense ratio
of the recently acquired and opened Deals stores.
Operating Earnings
The company’s operating earnings were $569.9 million for 2003 compared to $504.8 million for 2002, a
12.9 percent increase. Fiscal 2003 operating earnings include $2.9 million for restructure and other charges.
Fiscal 2002 operating earnings include $46.3 million for restructure and other charges and $12.5 million in store
closing reserves recorded in the fourth quarter. Retail food 2003 operating earnings increased 20.2 percent to
$436.5 million, or 4.4 percent of net sales, from 2002 operating earnings of $363.3 million, or 3.8 percent of net
sales. Fiscal 2002 retail food operating earnings include goodwill amortization of $25.3 million. The remaining
increase in retail food operating earnings was primarily due to growth of new stores and improved merchandising
execution in retail. Food distribution 2003 operating earnings decreased 24.4 percent to $171.6 million, or
1.8 percent of net sales, from 2002 operating earnings of $227.0 million, or 2.1 percent of net sales. Fiscal 2002
food distribution operating earnings included goodwill amortization of $23.1 million. The decrease in food
distribution operating earnings primarily reflects the decrease in sales volume and a change in our distribution
customer mix.
Net Interest Expense
Interest expense decreased to $182.5 million in 2003 compared with $194.3 million in 2002, reflecting
lower borrowing levels and lower average interest rates, largely due to the interest rate swap agreements entered
into in the first quarter of fiscal 2003. Interest income decreased to $20.6 million in 2003 compared with
$21.5 million in 2002.
Income Taxes
The effective tax rate was 37.0 percent in 2003 compared with 40.3 percent in 2002. The decrease in the
effective tax rate was due to the discontinuation of goodwill amortization as of February 24, 2002, which is not
deductible for income tax purposes.
Net Earnings
Net earnings were $257.0 million, or $1.91 per diluted share, in 2003 compared with net earnings of
$198.3 million, or $1.48 per diluted share in 2002.
11