eBay 2011 Annual Report Download - page 66
Download and view the complete annual report
Please find page 66 of the 2011 eBay annual report below. You can navigate through the pages in the report by either clicking on the pages listed below, or by using the keyword search tool below to find specific information within the annual report.-
 1
1 -
2
-
3
-
4
-
5
-
6
-
7
-
8
-
9
-
10
-
11
-
12
-
13
-
14
-
15
-
16
-
17
-
18
-
19
-
20
-
21
-
22
-
23
-
24
-
25
-
26
-
27
-
28
-
29
-
30
-
31
-
32
-
33
-
34
-
35
-
36
-
37
-
38
-
39
-
40
-
41
-
42
-
43
-
44
-
45
-
46
-
47
-
48
-
49
-
50
-
51
-
52
-
53
-
54
-
55
-
 56
56 -
 57
57 -
 58
58 -
 59
59 -
 60
60 -
 61
61 -
 62
62 -
 63
63 -
 64
64 -
 65
65 -
 66
66 -
 67
67 -
 68
68 -
 69
69 -
 70
70 -
 71
71 -
 72
72 -
 73
73 -
 74
74 -
 75
75 -
 76
76 -
77
-
78
-
79
-
80
-
81
-
82
-
83
-
84
-
85
-
86
-
87
-
88
-
89
-
90
-
91
-
92
-
93
-
94
-
95
-
96
-
97
-
98
-
99
-
100
-
101
-
102
-
103
-
104
-
105
-
106
-
107
-
108
-
109
-
110
-
111
-
112
-
113
-
114
-
115
-
116
-
117
-
118
-
119
-
120
-
121
-
122
-
123
-
124
-
125
-
126
-
127
-
128
-
129
-
130
-
131
-
132
-
133
-
134
-
135
-
136
-
137
-
138
-
139
-
140
-
141
-
142
-
143
-
144
-
145
-
146
-
147
-
148
-
149
-
150
-
151
-
152
-
153
-
154
-
155
-
156
-
157
-
158
-
159
 |
 |

Marketplaces cost of net revenues increased $103.2 million , or 11% , in 2010 compared to 2009 . The increase during 2010 was due
primarily to the inclusion of a full year of costs attributable to Gmarket and increased site operation costs. Marketplaces cost of net revenues as a
percentage of Marketplaces net revenues increased slightly in 2010 compared to 2009
due primarily to the addition of Gmarket, the settlement of a
lawsuit and the establishment of a reserve related to certain indirect tax positions (recorded as a reduction in revenue).
Payments
Payments cost of net revenues increased $372.3 million , or 25% , in 2011 compared to 2010 due primarily to the impact of growth in net
TPV. Payments cost of net revenues as a percentage of Payments net revenues decreased during 2011, compared to 2010 due primarily to a lower
transaction expense rate. The improvement in our transaction expense rate was driven primarily by the impact of certain regulatory changes, new
payment processing arrangements, a favorable mix shift to lower cost international markets and a small improvement in funding mix.
Payments cost of net revenues increased $272.5 million , or 22% , in 2010 compared to 2009 . The increase in cost of net revenues was
primarily due to the impact from our growth in net TPV. Payments cost of net revenues as a percentage of Payments net revenues decreased
slightly in 2010 compared to 2009 due primarily to improved leverage of our customer support infrastructure and existing site operations.
GSI
GSI cost of net revenues were $374.1 million during 2011
, which represents GSI's cost of net revenues for the period from June 17, 2011
(the date the acquisition was completed) through December 31, 2011 .
Communications
On November 19, 2009, we completed the sale of Skype to an investor group. Accordingly, Skype's cost of net revenue is not consolidated
in our 2011 or 2010 results.
Summary of Operating Expenses, Non-Operating Items and Provision for Income Taxes
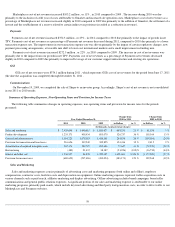
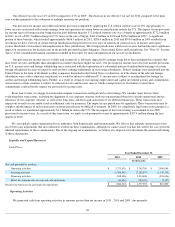
The following table summarizes changes in operating expenses, non-operating items and provision for income taxes for the periods
presented:
Sales and Marketing
Sales and marketing expenses consist primarily of advertising costs and marketing programs (both online and offline), employee
compensation, contractor costs, facilities costs and depreciation on equipment. Online marketing expenses represent traffic acquisition costs in
various channels such as paid search, affiliates marketing and display advertising. Offline advertising includes brand campaigns, buyer/seller
communications and general public relations expenses. A significant portion of our sales and marketing expense is attributable to our online
marketing programs, primarily paid search, which include keyword advertising and third party lead generation costs, in order to drive traffic to our
Marketplaces and Payments websites.
59
Year Ended December 31,
Change from
2010 to 2011
Change from
2009 to 2010
2011
2010
2009
in Dollars
in %
in Dollars
in %
(In thousands, except percentage changes)
Sales and marketing
$
2,435,048
$
1,946,815
$
1,885,677
$
488,233
25
%
$
61,138
3
%
Product development
1,235,171
908,434
803,070
326,737
36
%
105,364
13
%
General and administrative
1,364,221
1,079,383
1,418,389
284,838
26
%
(339,006
)
(24
)%
Provision for transaction and loan losses
516,656
392,240
382,825
124,416
32
%
9,415
2
%
Amortization of acquired intangible assets
267,374
189,727
262,686
77,647
41
%
(72,959
)
(28
)%
Restructuring
(489
)
21,437
38,187
(21,926
)
(102
)%
(16,750
)
(44
)%
Interest and other, net
1,536,557
44,876
1,422,385
1,491,681
3,324
%
(1,377,509
)
(97
)%
Provision for income taxes
(680,659
)
(297,486
)
(490,054
)
(383,173
)
129
%
192,568
(39
)%