eBay 2011 Annual Report Download - page 65
Download and view the complete annual report
Please find page 65 of the 2011 eBay annual report below. You can navigate through the pages in the report by either clicking on the pages listed below, or by using the keyword search tool below to find specific information within the annual report.-
 1
1 -
2
-
3
-
4
-
5
-
6
-
7
-
8
-
9
-
10
-
11
-
12
-
13
-
14
-
15
-
16
-
17
-
18
-
19
-
20
-
21
-
22
-
23
-
24
-
25
-
26
-
27
-
28
-
29
-
30
-
31
-
32
-
33
-
34
-
35
-
36
-
37
-
38
-
39
-
40
-
41
-
42
-
43
-
44
-
45
-
46
-
47
-
48
-
49
-
50
-
51
-
52
-
53
-
54
-
 55
55 -
 56
56 -
 57
57 -
 58
58 -
 59
59 -
 60
60 -
 61
61 -
 62
62 -
 63
63 -
 64
64 -
 65
65 -
 66
66 -
 67
67 -
 68
68 -
 69
69 -
 70
70 -
 71
71 -
 72
72 -
 73
73 -
 74
74 -
 75
75 -
76
-
77
-
78
-
79
-
80
-
81
-
82
-
83
-
84
-
85
-
86
-
87
-
88
-
89
-
90
-
91
-
92
-
93
-
94
-
95
-
96
-
97
-
98
-
99
-
100
-
101
-
102
-
103
-
104
-
105
-
106
-
107
-
108
-
109
-
110
-
111
-
112
-
113
-
114
-
115
-
116
-
117
-
118
-
119
-
120
-
121
-
122
-
123
-
124
-
125
-
126
-
127
-
128
-
129
-
130
-
131
-
132
-
133
-
134
-
135
-
136
-
137
-
138
-
139
-
140
-
141
-
142
-
143
-
144
-
145
-
146
-
147
-
148
-
149
-
150
-
151
-
152
-
153
-
154
-
155
-
156
-
157
-
158
-
159
 |
 |
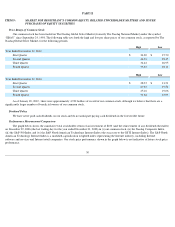
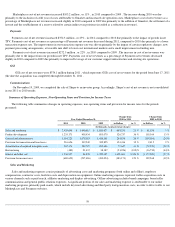
Marketing Services and Other Revenues
Marketing services and other revenues increased $542.6 million , or 50% , in 2011 compared to 2010 , and represented 14% and 12% of
total net revenues in 2011 and 2010 , respectively. The increase in marketing services and other revenues was primarily due to the acquisitions of
GSI and brands4friends and an increase in revenues attributable to our classifieds business and advertising business, as well as interest earned on
our Bill Me Later portfolio of receivables from loans.
Marketing services and other revenues increased $45.5 million , or 4% , in 2010 compared to 2009 , and represented 12% of total net
revenues in both 2010 and 2009 . The increase in marketing services and other revenues was primarily attributable to our advertising and
classifieds businesses, partially offset by the exclusion of marketing services and other revenues attributable to Skype.
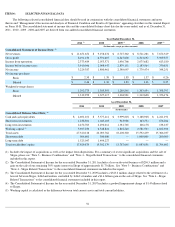
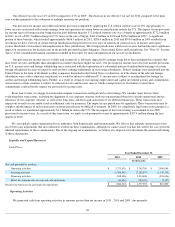
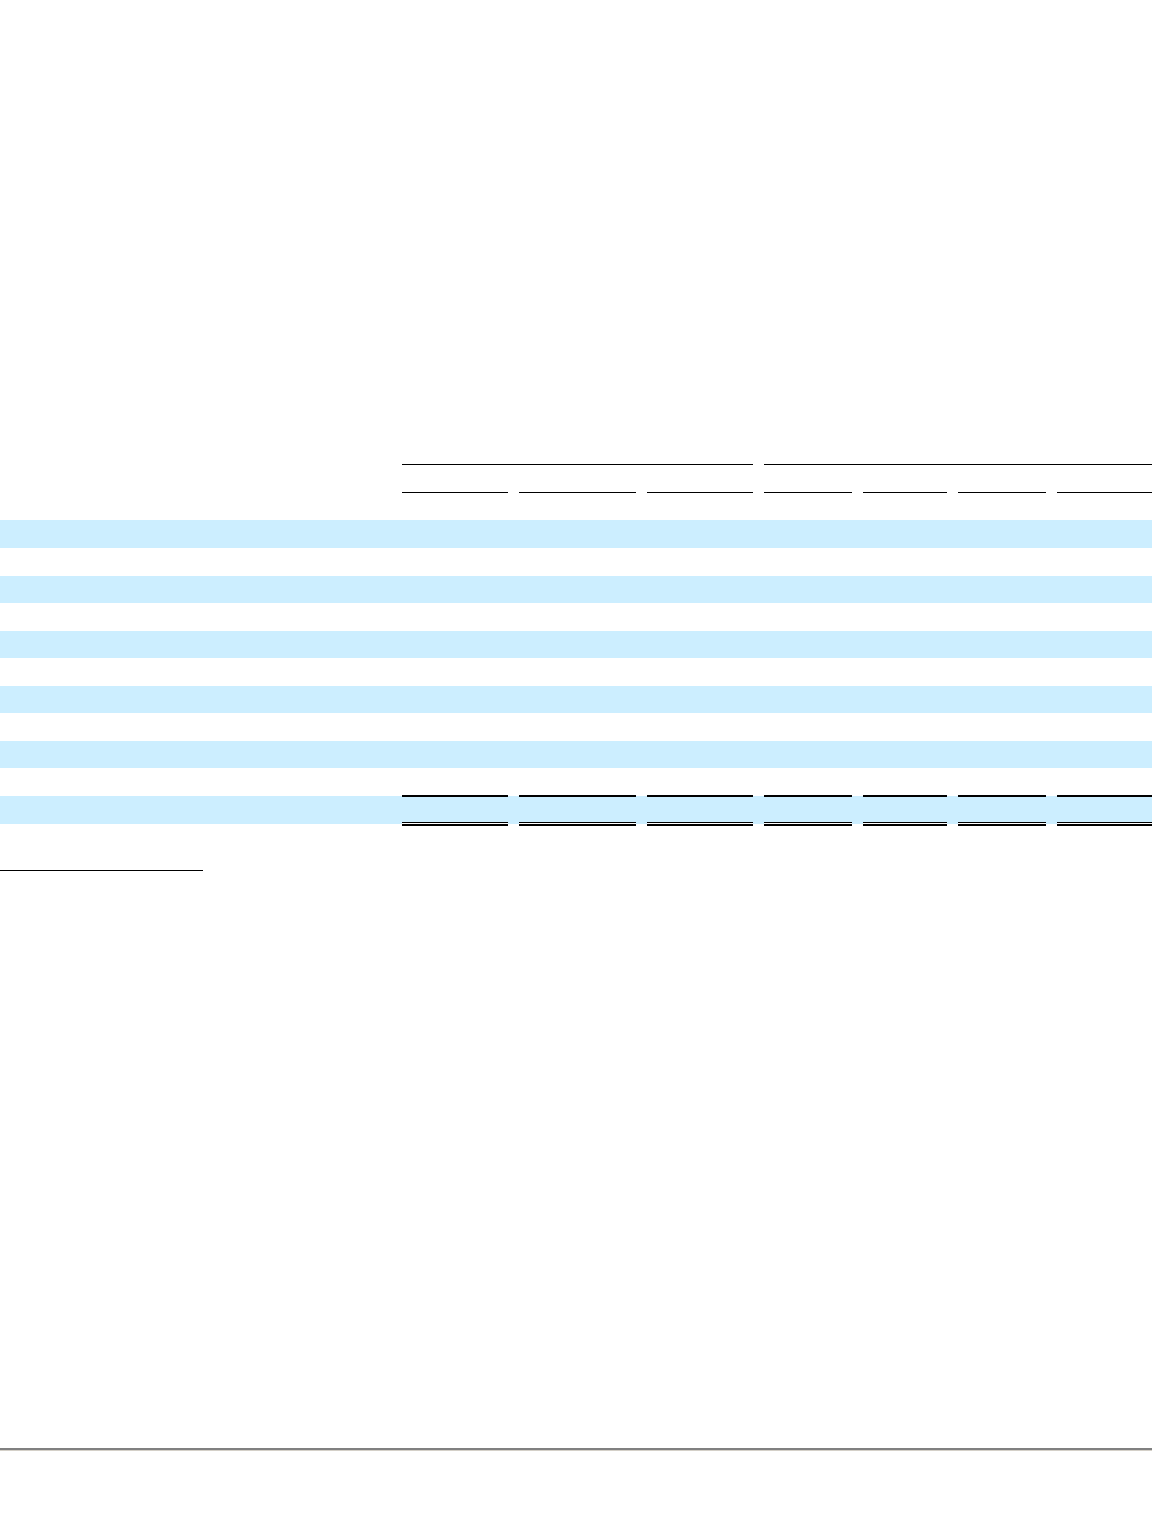
Summary of Cost of Net Revenues
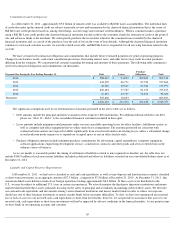
The following table summarizes changes in cost of net revenues for the periods presented:
(1) GSI was acquired in June 2011.
(2) Represents costs associated with our X.commerce initiative, which was launched in conjunction with our acquisition of Magento in the third
quarter of 2011.
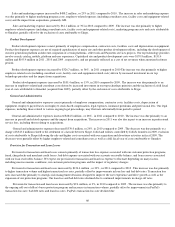
Cost of Net Revenues
Cost of net revenues consists primarily of costs associated with payment processing, customer support, site operations, fulfillment, inventory
and Skype telecommunications (through November 2009). Significant components of these costs include bank transaction fees, credit card
interchange and assessment fees, interest expense on indebtedness incurred to finance the purchase of consumer loan receivables related to Bill
Me Later accounts, employee compensation, contractor costs, facilities costs, depreciation of equipment and amortization expense.
Marketplaces
Marketplaces cost of net revenues increased $138.2 million , or 13% , in 2011 compared to 2010 . The increase during 2011 was due
primarily to the impact of acquiring brands4friends during the first quarter of 2011 and increased customer support costs associated with our GMV
growth. Marketplaces cost of net revenues as a percentage of Marketplaces net revenues decreased during 2011 compared to the same period of
the prior year due primarily to improved operating leverage in our site operation infrastructure, partially offset by the impact of acquisitions. In
addition, Marketplaces cost of net revenues as a percentage of Marketplaces net revenues in 2010 was adversely impacted by the settlement of a
lawsuit and the establishment of a reserve related to certain indirect tax positions (recorded as a reduction in revenue).
58
Year Ended December 31,
Change from
2010 to 2011
Change from
2009 to 2010
2011
2010
2009
in Dollars
in %
in Dollars
in %
(In thousands, except percentages)
Cost of net revenues:
Marketplaces
$
1,209,650
$
1,071,499
$
968,266
$
138,151
13
%
$
103,233
11
%
As a percentage of total Marketplaces net revenues
18.2
%
18.7
%
18.2
%
Payments
1,865,493
1,493,168
1,220,619
372,325
25
%
272,549
22
%
As a percentage of total Payments net revenues
42.3
%
43.5
%
43.7
%
GSI
(1)
374,117
—
—
374,117
N/A
—
N/A
As a percentage of total GSI net revenues
63.4
%
N/A
N/A
Communications —
—
290,877
—
N/A
(290,877
)
N/A
As a percentage of total Communications net revenues
N/A
N/A
46.9
%
Corporate and other
(2)
10,924
—
—
10,924
N/A
—
N/A
Total cost of net revenues
$
3,460,184
$
2,564,667
$
2,479,762
$
895,517
35
%
$
84,905
3
%
As a percentage of net revenues
29.7
%
28.0
%
28.4
%