eBay 2011 Annual Report Download - page 129
Download and view the complete annual report
Please find page 129 of the 2011 eBay annual report below. You can navigate through the pages in the report by either clicking on the pages listed below, or by using the keyword search tool below to find specific information within the annual report.-
 1
1 -
2
-
3
-
4
-
5
-
6
-
7
-
8
-
9
-
10
-
11
-
12
-
13
-
14
-
15
-
16
-
17
-
18
-
19
-
20
-
21
-
22
-
23
-
24
-
25
-
26
-
27
-
28
-
29
-
30
-
31
-
32
-
33
-
34
-
35
-
36
-
37
-
38
-
39
-
40
-
41
-
42
-
43
-
44
-
45
-
46
-
47
-
48
-
49
-
50
-
51
-
52
-
53
-
54
-
55
-
56
-
57
-
58
-
59
-
60
-
61
-
62
-
63
-
64
-
65
-
66
-
67
-
68
-
69
-
70
-
71
-
72
-
73
-
74
-
75
-
76
-
77
-
78
-
79
-
80
-
81
-
82
-
83
-
84
-
85
-
86
-
87
-
88
-
89
-
90
-
91
-
92
-
93
-
94
-
95
-
96
-
97
-
98
-
99
-
100
-
101
-
102
-
103
-
104
-
105
-
106
-
107
-
108
-
109
-
110
-
111
-
112
-
113
-
114
-
115
-
116
-
117
-
118
-
 119
119 -
 120
120 -
 121
121 -
 122
122 -
 123
123 -
 124
124 -
 125
125 -
 126
126 -
 127
127 -
 128
128 -
 129
129 -
 130
130 -
 131
131 -
 132
132 -
 133
133 -
 134
134 -
 135
135 -
 136
136 -
 137
137 -
 138
138 -
 139
139 -
140
-
141
-
142
-
143
-
144
-
145
-
146
-
147
-
148
-
149
-
150
-
151
-
152
-
153
-
154
-
155
-
156
-
157
-
158
-
159
 |
 |

eBay Inc.
NOTES TO CONSOLIDATED FINANCIAL STATEMENTS—(Continued)
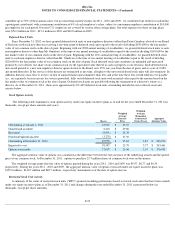
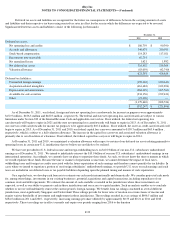
Nonvested Shares Activity
A summary of the status of and changes in nonvested shares granted under our equity incentive plans and assumed in acquisitions as of
December 31, 2011 and changes during the year ended December 31, 2011 is presented below (in thousands, except per share amounts):
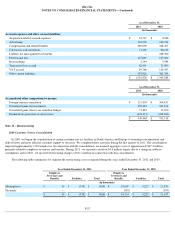
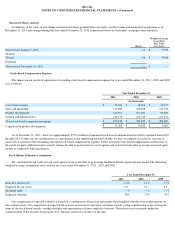
Stock-based Compensation Expense
The impact on our results of operations of recording stock-based compensation expense for years ended December 31, 2011 , 2010 and
2009
was as follows:
As of December 31, 2011 , there was approximately $770.4 million of unearned stock-based compensation that will be expensed from 2012
through 2015. If there are any modifications or cancellations of the underlying unvested awards, we may be required to accelerate, increase or
cancel all or a portion of the remaining unearned stock-based compensation expense. Future unearned stock-based compensation will increase to
the extent we grant additional equity awards, change the mix of grants between stock options and restricted stock units or assume unvested equity
awards in connection with acquisitions.
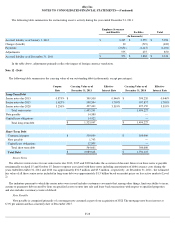
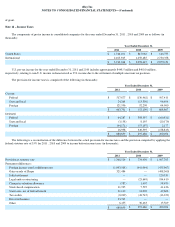
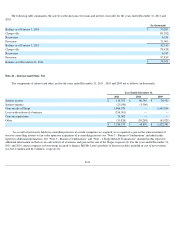
Stock Option Valuation Assumptions
We calculated the fair value of each stock option award on the date of grant using the Black-Scholes option pricing model. The following
weighted average assumptions were used for the years ended December 31, 2011 , 2010 and 2009 :
Our computation of expected volatility is based on a combination of historical and market-based implied volatility from traded options on
our common stock. Our computation of expected life is based on historical experience of similar awards, giving consideration to the contractual
terms of the stock-based awards, vesting schedules and expectations of future employee behavior. The interest rate for periods within the
contractual life of the award is based on the U.S. Treasury yield curve in effect at the time
Shares
Weighted Average
Grant-Date
Fair Value
(per share)
Nonvested at January 1, 2011
10
$
39.90
Granted —
—
Vested
(10
)
$
39.90
Forfeited —
—
Nonvested at December 31, 2011 —
$
—
Year Ended December 31,
2011
2010
2009
(In thousands)
Cost of net revenues
$
55,924
$
48,764
$
49,275
Sales and marketing
131,800
106,208
121,724
Product development
122,691
101,001
98,609
General and administrative
146,773
125,519
125,199
Total stock-based compensation expense
$
457,188
$
381,492
$
394,807
Capitalized in product development
$
17,022
$
10,484
$
9,060
Year Ended December 31,
2011
2010
2009
Risk-free interest rate
1.2
%
1.4
%
1.7
%
Expected life (in years)
3.8
3.4
3.8
Dividend yield
—
%
—
%
—
%
Expected volatility
38
%
37
%
47
%