eBay 2011 Annual Report Download - page 115
Download and view the complete annual report
Please find page 115 of the 2011 eBay annual report below. You can navigate through the pages in the report by either clicking on the pages listed below, or by using the keyword search tool below to find specific information within the annual report.-
 1
1 -
2
-
3
-
4
-
5
-
6
-
7
-
8
-
9
-
10
-
11
-
12
-
13
-
14
-
15
-
16
-
17
-
18
-
19
-
20
-
21
-
22
-
23
-
24
-
25
-
26
-
27
-
28
-
29
-
30
-
31
-
32
-
33
-
34
-
35
-
36
-
37
-
38
-
39
-
40
-
41
-
42
-
43
-
44
-
45
-
46
-
47
-
48
-
49
-
50
-
51
-
52
-
53
-
54
-
55
-
56
-
57
-
58
-
59
-
60
-
61
-
62
-
63
-
64
-
65
-
66
-
67
-
68
-
69
-
70
-
71
-
72
-
73
-
74
-
75
-
76
-
77
-
78
-
79
-
80
-
81
-
82
-
83
-
84
-
85
-
86
-
87
-
88
-
89
-
90
-
91
-
92
-
93
-
94
-
95
-
96
-
97
-
98
-
99
-
100
-
101
-
102
-
103
-
104
-
 105
105 -
 106
106 -
 107
107 -
 108
108 -
 109
109 -
 110
110 -
 111
111 -
 112
112 -
 113
113 -
 114
114 -
 115
115 -
 116
116 -
 117
117 -
 118
118 -
 119
119 -
 120
120 -
 121
121 -
 122
122 -
 123
123 -
 124
124 -
 125
125 -
126
-
127
-
128
-
129
-
130
-
131
-
132
-
133
-
134
-
135
-
136
-
137
-
138
-
139
-
140
-
141
-
142
-
143
-
144
-
145
-
146
-
147
-
148
-
149
-
150
-
151
-
152
-
153
-
154
-
155
-
156
-
157
-
158
-
159
 |
 |
eBay Inc.
NOTES TO CONSOLIDATED FINANCIAL STATEMENTS—(Continued)
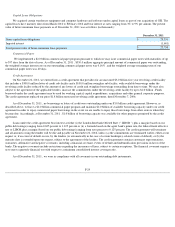
Equity and cost method investments
We have made multiple equity and cost method investments which are reported in long-term investments on our consolidated balance sheet.
As of December 31, 2011 and 2010 , our equity and cost method investments totaled $189.9 million and $729.4 million , respectively.
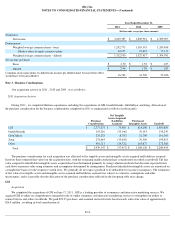
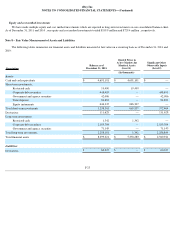
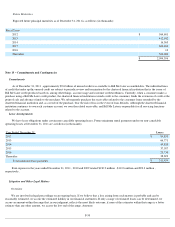
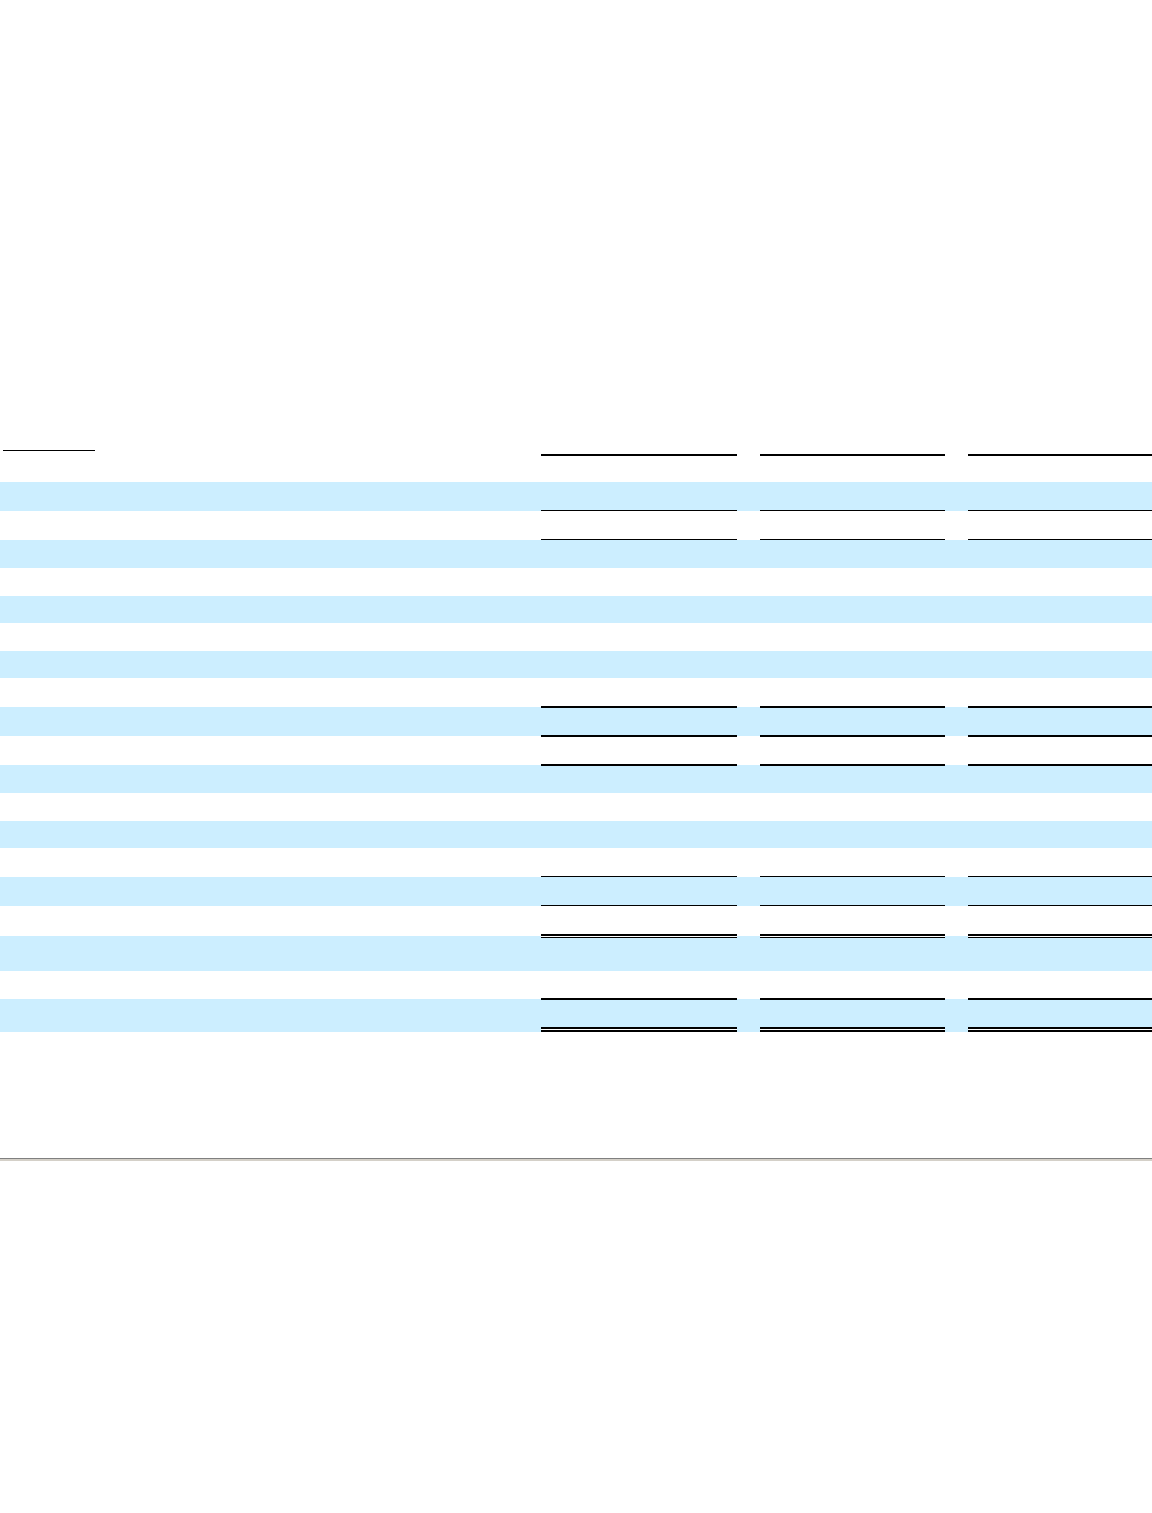
Note 8 – Fair Value Measurement of Assets and Liabilities
The following tables summarize our financial assets and liabilities measured at fair value on a recurring basis as of December 31, 2011 and
2010 :
F-23
Description
Balance as of
December 31, 2011
Quoted Prices in
Active Markets for
Identical Assets
(Level 1)
Significant Other
Observable Inputs
(Level 2)
(In thousands)
Assets:
Cash and cash equivalents
$
4,691,101
$
4,691,101
$
—
Short-term investments:
Restricted cash
19,490
19,490
—
Corporate debt securities
448,495
—
448,495
Government and agency securities
42,086
—
42,086
Time deposits
81,883
—
81,883
Equity instruments
646,347
646,347
—
Total short-term investments
1,238,301
665,837
572,464
Derivatives
111,628
—
111,628
Long-term investments:
Restricted cash
1,342
1,342
—
Corporate debt securities
2,185,704
—
2,185,704
Government and agency securities
71,145
—
71,145
Total long-term investments
2,258,191
1,342
2,256,849
Total financial assets
$
8,299,221
$
5,358,280
$
2,940,941
Liabilities:
Derivatives
$
60,227
$
—
$
60,227