eBay 2011 Annual Report Download - page 60
Download and view the complete annual report
Please find page 60 of the 2011 eBay annual report below. You can navigate through the pages in the report by either clicking on the pages listed below, or by using the keyword search tool below to find specific information within the annual report.-
 1
1 -
2
-
3
-
4
-
5
-
6
-
7
-
8
-
9
-
10
-
11
-
12
-
13
-
14
-
15
-
16
-
17
-
18
-
19
-
20
-
21
-
22
-
23
-
24
-
25
-
26
-
27
-
28
-
29
-
30
-
31
-
32
-
33
-
34
-
35
-
36
-
37
-
38
-
39
-
40
-
41
-
42
-
43
-
44
-
45
-
46
-
47
-
48
-
49
-
 50
50 -
 51
51 -
 52
52 -
 53
53 -
 54
54 -
 55
55 -
 56
56 -
 57
57 -
 58
58 -
 59
59 -
 60
60 -
 61
61 -
 62
62 -
 63
63 -
 64
64 -
 65
65 -
 66
66 -
 67
67 -
 68
68 -
 69
69 -
 70
70 -
71
-
72
-
73
-
74
-
75
-
76
-
77
-
78
-
79
-
80
-
81
-
82
-
83
-
84
-
85
-
86
-
87
-
88
-
89
-
90
-
91
-
92
-
93
-
94
-
95
-
96
-
97
-
98
-
99
-
100
-
101
-
102
-
103
-
104
-
105
-
106
-
107
-
108
-
109
-
110
-
111
-
112
-
113
-
114
-
115
-
116
-
117
-
118
-
119
-
120
-
121
-
122
-
123
-
124
-
125
-
126
-
127
-
128
-
129
-
130
-
131
-
132
-
133
-
134
-
135
-
136
-
137
-
138
-
139
-
140
-
141
-
142
-
143
-
144
-
145
-
146
-
147
-
148
-
149
-
150
-
151
-
152
-
153
-
154
-
155
-
156
-
157
-
158
-
159
 |
 |

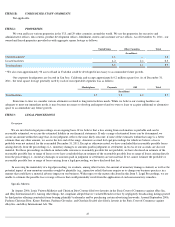
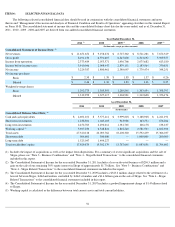
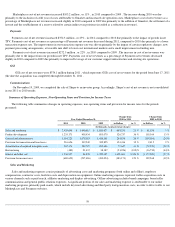
The following table sets forth the breakdown of net revenues by type and geography for the periods presented.
(1) Includes Communications segment revenue generated by Skype until its sale on November 19, 2009.
(2) Represents revenues associated with our X.commerce initiative, which was launched in conjunction with our acquisition of Magento in the
third quarter of 2011.
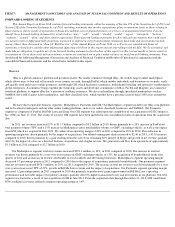
Revenues are attributed to U.S. and international geographies based primarily upon the country in which the seller, payment recipient,
customer, website that displays advertising, or other service provider, or until the sale of Skype on November 19, 2009, the Skype user's Internet
protocol address, as the case may be, is located.
Because we generated the majority of our net revenues internationally in recent periods, including the
years ended December 31, 2011, 2010 and 2009, we are subject to the risks of doing business in foreign countries as discussed under “Item 1A:
Risk Factors.” In that regard, fluctuations in foreign currency exchange rates impact our results of operations. We have a foreign exchange risk
management program that is designed to reduce our exposure to fluctuations in foreign currencies; however, the effectiveness of this program in
mitigating the impact of foreign currency fluctuations on our results of operations varies from period to period, and in any given period, our
operating results are usually affected, sometimes significantly, by changes in currency exchange rates. Fluctuations in exchange rates also directly
affect our cross-border revenue. We calculate the year-over-
year impact of foreign currency movements on our business using prior period foreign
currency rates applied to current year transactional currency amounts.
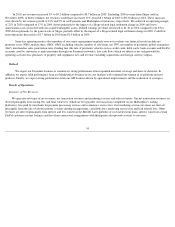
For the year ended December 31, 2011 , foreign currency movements relative to the U.S. dollar positively impacted net revenues by
approximately $202.4 million (net of a $25.9 million negative impact from hedging activities relating to PayPal's net revenue) compared to the
prior year. Foreign currency movements relative to the U.S. dollar for the year ended December 31, 2011 , positively impacted Marketplaces and
Payments net revenues by approximately $166.6 million and $35.6 million , respectively, compared to the prior year (net of the impact of hedging
activities, noted above, in the case of Payments net revenues).
For the year ended December 31, 2010 , foreign currency movements relative to the U.S. dollar negatively impacted net revenues by
approximately $9.6 million (net of $11.1 million positive impact from hedging activities relating to PayPal's net revenue) compared to the prior
year. Foreign currency movements relative to the U.S. dollar for the year ended December 31, 2010 , negatively impacted Marketplaces and
Payments net revenues by approximately $7.1 million and $2.5 million , respectively, compared to the prior year (net of the impact of hedging
activities, noted above, in the case of Payments net
55
Year Ended December 31,
Percent Change
from
Percent Change
from
2011
2010
2009
(1)
2010 to 2011
2009 to 2010
(In thousands, except percentage changes)
Net Revenues by Type:
Net transaction revenues
Marketplaces
$
5,431,308
$
4,800,193
$
4,461,845
13
%
8
%
Payments
4,123,302
3,261,314
2,641,194
26
%
23
%
GSI
459,659
—
—
N/A
N/A
Communications —
—
575,096
N/A
N/A
Total net transaction revenues
10,014,269
8,061,507
7,678,135
24
%
5
%
Marketing services and other revenues
Marketplaces
1,210,462
920,434
849,169
32
%
8
%
Payments
288,833
174,333
154,751
66
%
13
%
GSI
130,405
—
—
N/A
N/A
Communications —
—
45,307
N/A
N/A
Corporate and other
(2)
7,685
—
—
N/A
N/A
Total marketing services and other revenues
1,637,385
1,094,767
1,049,227
50
%
4
%
Total net revenues
$
11,651,654
$
9,156,274
$
8,727,362
27
%
5
%
Net Revenues by Geography:
U.S.
$
5,483,641
$
4,214,215
$
3,985,068
30
%
6
%
International
6,168,013
4,942,059
4,742,294
25
%
4
%
Total net revenues
$
11,651,654
$
9,156,274
$
8,727,362
27
%
5
%