eBay 2011 Annual Report Download - page 111
Download and view the complete annual report
Please find page 111 of the 2011 eBay annual report below. You can navigate through the pages in the report by either clicking on the pages listed below, or by using the keyword search tool below to find specific information within the annual report.-
 1
1 -
2
-
3
-
4
-
5
-
6
-
7
-
8
-
9
-
10
-
11
-
12
-
13
-
14
-
15
-
16
-
17
-
18
-
19
-
20
-
21
-
22
-
23
-
24
-
25
-
26
-
27
-
28
-
29
-
30
-
31
-
32
-
33
-
34
-
35
-
36
-
37
-
38
-
39
-
40
-
41
-
42
-
43
-
44
-
45
-
46
-
47
-
48
-
49
-
50
-
51
-
52
-
53
-
54
-
55
-
56
-
57
-
58
-
59
-
60
-
61
-
62
-
63
-
64
-
65
-
66
-
67
-
68
-
69
-
70
-
71
-
72
-
73
-
74
-
75
-
76
-
77
-
78
-
79
-
80
-
81
-
82
-
83
-
84
-
85
-
86
-
87
-
88
-
89
-
90
-
91
-
92
-
93
-
94
-
95
-
96
-
97
-
98
-
99
-
100
-
 101
101 -
 102
102 -
 103
103 -
 104
104 -
 105
105 -
 106
106 -
 107
107 -
 108
108 -
 109
109 -
 110
110 -
 111
111 -
 112
112 -
 113
113 -
 114
114 -
 115
115 -
 116
116 -
 117
117 -
 118
118 -
 119
119 -
 120
120 -
 121
121 -
122
-
123
-
124
-
125
-
126
-
127
-
128
-
129
-
130
-
131
-
132
-
133
-
134
-
135
-
136
-
137
-
138
-
139
-
140
-
141
-
142
-
143
-
144
-
145
-
146
-
147
-
148
-
149
-
150
-
151
-
152
-
153
-
154
-
155
-
156
-
157
-
158
-
159
 |
 |

eBay Inc.
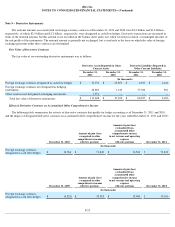
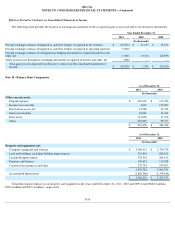
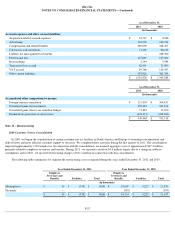
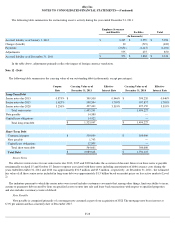
NOTES TO CONSOLIDATED FINANCIAL STATEMENTS—(Continued)
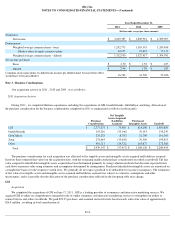
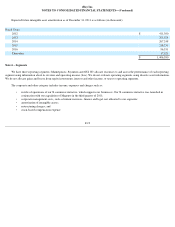
The following tables summarize the financial performance of our operating segments (in the case of our GSI segment, the following
information reflects its operating results from June 17, 2011, the date we acquired GSI):
F-20
Year Ended December 31,
2011
2010
2009
(In thousands)
Net Revenue
Marketplaces
Net transaction revenues
$
5,431,308
$
4,800,193
$
4,461,845
Marketing services and other revenues
1,210,462
920,434
849,169
6,641,770
5,720,627
5,311,014
Payments
Net transaction revenues
4,123,302
3,261,314
2,641,194
Marketing services and other revenues
288,833
174,333
154,751
4,412,135
3,435,647
2,795,945
GSI
Net transaction revenues
459,659
—
—
Marketing services and other revenues
130,405
—
—
590,064
—
—
Communications
Net transaction revenues
—
—
575,096
Marketing services and other revenues
—
—
45,307
—
—
620,403
Corporate and other
Marketing services and other revenues
7,685
—
—
Total net revenue
$
11,651,654
$
9,156,274
$
8,727,362
Operating income (loss)
Marketplaces
$
2,630,639
$
2,304,748
$
2,251,920
Payments
978,042
721,641
463,382
GSI
83,241
—
—
Communications
—
—
157,702
Corporate and other
(1,318,433
)
(972,818
)
(1,416,238
)
Total operating income (loss)
$
2,373,489
$
2,053,571
$
1,456,766