eBay 2011 Annual Report Download - page 55
Download and view the complete annual report
Please find page 55 of the 2011 eBay annual report below. You can navigate through the pages in the report by either clicking on the pages listed below, or by using the keyword search tool below to find specific information within the annual report.-
 1
1 -
2
-
3
-
4
-
5
-
6
-
7
-
8
-
9
-
10
-
11
-
12
-
13
-
14
-
15
-
16
-
17
-
18
-
19
-
20
-
21
-
22
-
23
-
24
-
25
-
26
-
27
-
28
-
29
-
30
-
31
-
32
-
33
-
34
-
35
-
36
-
37
-
38
-
39
-
40
-
41
-
42
-
43
-
44
-
 45
45 -
 46
46 -
 47
47 -
 48
48 -
 49
49 -
 50
50 -
 51
51 -
 52
52 -
 53
53 -
 54
54 -
 55
55 -
 56
56 -
 57
57 -
 58
58 -
 59
59 -
 60
60 -
 61
61 -
 62
62 -
 63
63 -
 64
64 -
 65
65 -
66
-
67
-
68
-
69
-
70
-
71
-
72
-
73
-
74
-
75
-
76
-
77
-
78
-
79
-
80
-
81
-
82
-
83
-
84
-
85
-
86
-
87
-
88
-
89
-
90
-
91
-
92
-
93
-
94
-
95
-
96
-
97
-
98
-
99
-
100
-
101
-
102
-
103
-
104
-
105
-
106
-
107
-
108
-
109
-
110
-
111
-
112
-
113
-
114
-
115
-
116
-
117
-
118
-
119
-
120
-
121
-
122
-
123
-
124
-
125
-
126
-
127
-
128
-
129
-
130
-
131
-
132
-
133
-
134
-
135
-
136
-
137
-
138
-
139
-
140
-
141
-
142
-
143
-
144
-
145
-
146
-
147
-
148
-
149
-
150
-
151
-
152
-
153
-
154
-
155
-
156
-
157
-
158
-
159
 |
 |
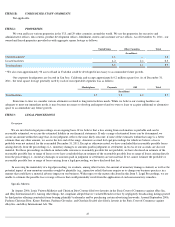
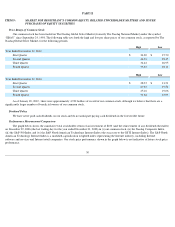
PART II
Price Range of Common Stock
Our common stock has been traded on The Nasdaq Global Select Market (formerly The Nasdaq National Market) under the symbol
“EBAY” since September 24, 1998. The following table sets forth the high and low per share prices of our common stock, as reported by The
Nasdaq Global Select Market, for the following periods.
As of January 20, 2012 , there were approximately 4,922 holders of record of our common stock, although we believe that there are a
significantly larger number of beneficial owners of our common stock.
Dividend Policy
We have never paid cash dividends on our stock and do not anticipate paying cash dividends in the foreseeable future.
Performance Measurement Comparison
The graph below shows the cumulative total stockholder return of an investment of $100 (and the reinvestment of any dividends thereafter)
on December 29, 2006 (the last trading day for the year ended December 31, 2006) in (i) our common stock, (ii) the Nasdaq Composite Index,
(iii) the S&P 500 Index and (iv) the S&P North American Technology Internet Index (the successor to the GSTI Internet Index). The S&P North
American Technology Internet Index is a modified-capitalization weighted index representing the Internet industry, including Internet
software and services and Internet retail companies. Our stock price performance shown in the graph below is not indicative of future stock price
performance.
50
ITEM 5:
MARKET FOR REGISTRANT'S COMMON EQUITY, RELATED STOCKHOLDER MATTERS AND ISSUER
PURCHASES OF EQUITY SECURITIES
High
Low
Year Ended December 31, 2011
First Quarter
$
34.69
$
27.70
Second Quarter
34.39
28.35
Third Quarter
34.42
26.95
Fourth Quarter
33.87
28.11
High
Low
Year Ended December 31, 2010
First Quarter
$
28.37
$
21.51
Second Quarter
27.67
19.54
Third Quarter
25.16
19.06
Fourth Quarter
31.64
23.93