eBay 2011 Annual Report Download - page 64
Download and view the complete annual report
Please find page 64 of the 2011 eBay annual report below. You can navigate through the pages in the report by either clicking on the pages listed below, or by using the keyword search tool below to find specific information within the annual report.-
 1
1 -
2
-
3
-
4
-
5
-
6
-
7
-
8
-
9
-
10
-
11
-
12
-
13
-
14
-
15
-
16
-
17
-
18
-
19
-
20
-
21
-
22
-
23
-
24
-
25
-
26
-
27
-
28
-
29
-
30
-
31
-
32
-
33
-
34
-
35
-
36
-
37
-
38
-
39
-
40
-
41
-
42
-
43
-
44
-
45
-
46
-
47
-
48
-
49
-
50
-
51
-
52
-
53
-
 54
54 -
 55
55 -
 56
56 -
 57
57 -
 58
58 -
 59
59 -
 60
60 -
 61
61 -
 62
62 -
 63
63 -
 64
64 -
 65
65 -
 66
66 -
 67
67 -
 68
68 -
 69
69 -
 70
70 -
 71
71 -
 72
72 -
 73
73 -
 74
74 -
75
-
76
-
77
-
78
-
79
-
80
-
81
-
82
-
83
-
84
-
85
-
86
-
87
-
88
-
89
-
90
-
91
-
92
-
93
-
94
-
95
-
96
-
97
-
98
-
99
-
100
-
101
-
102
-
103
-
104
-
105
-
106
-
107
-
108
-
109
-
110
-
111
-
112
-
113
-
114
-
115
-
116
-
117
-
118
-
119
-
120
-
121
-
122
-
123
-
124
-
125
-
126
-
127
-
128
-
129
-
130
-
131
-
132
-
133
-
134
-
135
-
136
-
137
-
138
-
139
-
140
-
141
-
142
-
143
-
144
-
145
-
146
-
147
-
148
-
149
-
150
-
151
-
152
-
153
-
154
-
155
-
156
-
157
-
158
-
159
 |
 |

We expect transaction activity patterns on our websites to mirror general consumer buying patterns. Our GSI segment is highly seasonal.
The fourth calendar quarter typically accounts for a disproportionate amount of GSI's total annual revenue because consumers increase their
purchases and businesses increase their advertising to consumers during the fourth quarter holiday season.
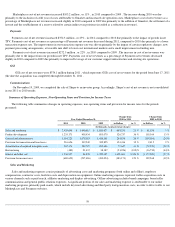
Marketplaces Net Transaction Revenues
Marketplaces net transaction revenues increased $631.1 million , or 13% , in 2011 compared to 2010 , consistent with the increase in GMV
excluding vehicles of 13% in 2011 compared to 2010 . The increase in net transaction revenue and GMV excluding vehicles was due primarily to
improvements in the shopping experience, foreign currency movements relative to the U.S. dollar and continued growth at StubHub. Net
transaction revenues and GMV excluding vehicles increased in the U.S., Europe and Asia in 2011 compared to 2010.
Marketplaces net transaction revenues increased $338.3 million , or 8% , in 2010 compared to 2009 , while GMV excluding vehicles
increased 11% in 2010 compared to 2009 . The increase in net transaction revenues was due primarily to the growth in the number of sold items,
inclusion of a full year of revenue generated from Gmarket (acquired June 2009) and growth at StubHub, partially offset by the impact of pricing
initiatives, including larger discounts to our highest-rated sellers, the settlement of a lawsuit and the establishment of a reserve related to certain
indirect tax positions (all recorded as a reduction in revenue).
Marketplaces net transaction revenues earned internationally totaled $3.1 billion , $2.7 billion and $2.4 billion in 2011 , 2010 and 2009 ,
representing 56% , 56% and 55% of total Marketplaces net transaction revenues, respectively. The increase in the dollar amount of international
net transaction revenues was due primarily to growth in our existing international markets and foreign currency movements relative to the U.S.
dollar.
Payments Net Transaction Revenues
Payments net transaction revenues increased $862.0 million , or 26% , during 2011 compared to 2010 , due primarily to net TPV growth of
29% . The increase in net TPV was due primarily to growth in consumer and merchant adoption of PayPal. Our Merchant Services net TPV
increased 36% during 2011 , compared to 2010 , and represented 65% of PayPal's net TPV in 2011 , compared with 62% in 2010
. The increase in
our Merchant Services net TPV was due primarily to an increase in the number of online merchants offering PayPal as a payment option.
Payments net transaction revenues increased $620.1 million , or 23% , in 2010 compared to 2009 . The increase was due primarily to net
TPV growth of 28% in 2010 compared to 2009 , partially offset by lower take rates due primarily to a shift to larger merchants in our Merchant
Services business. The increase in net TPV during 2010
was due primarily to growth in consumer and merchant adoption of PayPal. Our Merchant
Services net TPV experienced 42% growth in 2010 compared to 2009 and represented 62% of PayPal's net TPV in 2010 compared to 56% in
2009. The increase in our Merchant Services business was due primarily to an increase in the number of online merchants offering PayPal as a
payment option, as well as an increase in the share of checkout of PayPal's existing customer base of merchants.
Payments net transaction revenues earned internationally totaled $2.2 billion , $1.6 billion and $1.2 billion in 2011 , 2010 and 2009 ,
representing 53% , 49% and 46% of total Payments net transaction revenues, respectively. The increase in international net transaction revenues
was due primarily to the growth of our Merchant Services business and increased penetration on eBay Marketplaces platforms internationally, as
well as foreign currency movements relative to the U.S. dollar.
GSI Net Transaction Revenues
GSI net transaction revenues were $459.7 million in 2011 , which represents the revenues generated from ecommerce services from our
recently acquired GSI business for the period from June 17, 2011 (the date the acquisition of GSI was completed) through December 31, 2011 .
Communications Net Transaction Revenues
On November 19, 2009, we completed the sale of a 70% equity interest in Skype to an investor group. Accordingly, Skype's revenue is not
consolidated in our 2011 or 2010 results. However, Skype's results of operations are consolidated in our 2009 results through the date of sale.
57