eBay 2011 Annual Report Download - page 59
Download and view the complete annual report
Please find page 59 of the 2011 eBay annual report below. You can navigate through the pages in the report by either clicking on the pages listed below, or by using the keyword search tool below to find specific information within the annual report.-
 1
1 -
2
-
3
-
4
-
5
-
6
-
7
-
8
-
9
-
10
-
11
-
12
-
13
-
14
-
15
-
16
-
17
-
18
-
19
-
20
-
21
-
22
-
23
-
24
-
25
-
26
-
27
-
28
-
29
-
30
-
31
-
32
-
33
-
34
-
35
-
36
-
37
-
38
-
39
-
40
-
41
-
42
-
43
-
44
-
45
-
46
-
47
-
48
-
 49
49 -
 50
50 -
 51
51 -
 52
52 -
 53
53 -
 54
54 -
 55
55 -
 56
56 -
 57
57 -
 58
58 -
 59
59 -
 60
60 -
 61
61 -
 62
62 -
 63
63 -
 64
64 -
 65
65 -
 66
66 -
 67
67 -
 68
68 -
 69
69 -
70
-
71
-
72
-
73
-
74
-
75
-
76
-
77
-
78
-
79
-
80
-
81
-
82
-
83
-
84
-
85
-
86
-
87
-
88
-
89
-
90
-
91
-
92
-
93
-
94
-
95
-
96
-
97
-
98
-
99
-
100
-
101
-
102
-
103
-
104
-
105
-
106
-
107
-
108
-
109
-
110
-
111
-
112
-
113
-
114
-
115
-
116
-
117
-
118
-
119
-
120
-
121
-
122
-
123
-
124
-
125
-
126
-
127
-
128
-
129
-
130
-
131
-
132
-
133
-
134
-
135
-
136
-
137
-
138
-
139
-
140
-
141
-
142
-
143
-
144
-
145
-
146
-
147
-
148
-
149
-
150
-
151
-
152
-
153
-
154
-
155
-
156
-
157
-
158
-
159
 |
 |

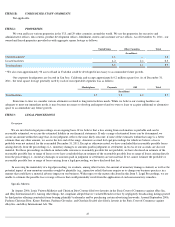
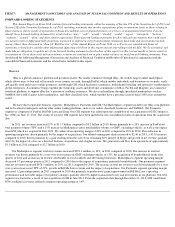
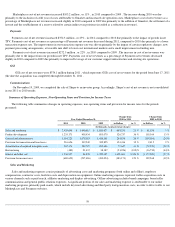
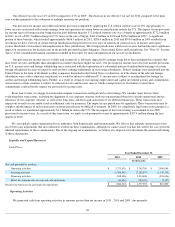
In 2010, net revenues increased 5% to $9.2 billion compared to $8.7 billion in 2009. Excluding 2009 revenue from Skype (sold in
November 2009) of $620.4 million, net revenues would have increased 13%, from $8.1 billion in 2009 to $9.2 billion in 2010. These increases
were driven by net revenue growth of 23% and 8% in our Payments and Marketplaces businesses, respectively. We achieved an operating margin
of 22% in 2010 compared to 17% in 2009, driven primarily by the impact of a Skype-related legal settlement charge in 2009 and lower
amortization costs associated with our acquired intangible assets. Diluted earnings per share decreased to $1.36 in 2010 compared to $1.83 in
2009 driven primarily by the gain on sale of Skype, partially offset by the impact of a Skype-related legal settlement charge in 2009. Cash flow
from operations decreased to $2.7 billion in 2010 from $2.9 billion in 2009.
Some key operating metrics that members of our senior management regularly review to evaluate our financial results include net
promoter score (NPS), market share, GMV, GMV excluding vehicles, number of sold items, net TPV, net number of payments, global ecommerce
(GeC) merchandise sales, penetration rates, funding mix (the mix of payments vehicles such as credit cards, debit cards, bank accounts and PayPal
accounts, used by customers to make payments through our Payments networks), free cash flow (which we define as net cash provided by
operating activities less purchases of property and equipment, net) and revenue excluding acquisitions and foreign currency impact.
Outlook
We expect our Payments business to continue its strong performance from expanded merchant coverage and share of checkout. In
addition, we expect solid performance from our Marketplaces business in its core markets with continued investment in its platform and new
products. Finally, we expect strong performance from our GSI business driven by operational improvements and the realization of synergies.
Results of Operations
Summary of Net Revenues
We generate two types of net revenues: net transaction revenues and marketing services and other revenues. Our net transaction revenues are
derived principally from listing fees and final value fees (which are fees payable on transactions completed on our Marketplaces trading
platforms), fees paid by merchants for payment processing services and ecommerce service fees. Our marketing services revenues are derived
principally from the sale of advertisements, revenue sharing arrangements, classifieds fees, marketing service fees and lead referral fees. Other
revenues are derived principally from interest and fees earned on the Bill Me Later portfolio of receivables from loans, interest earned on certain
PayPal customer account balances and fees from contractual arrangements with third parties that provide services to our users.
54