eBay 2011 Annual Report Download - page 127
Download and view the complete annual report
Please find page 127 of the 2011 eBay annual report below. You can navigate through the pages in the report by either clicking on the pages listed below, or by using the keyword search tool below to find specific information within the annual report.-
 1
1 -
2
-
3
-
4
-
5
-
6
-
7
-
8
-
9
-
10
-
11
-
12
-
13
-
14
-
15
-
16
-
17
-
18
-
19
-
20
-
21
-
22
-
23
-
24
-
25
-
26
-
27
-
28
-
29
-
30
-
31
-
32
-
33
-
34
-
35
-
36
-
37
-
38
-
39
-
40
-
41
-
42
-
43
-
44
-
45
-
46
-
47
-
48
-
49
-
50
-
51
-
52
-
53
-
54
-
55
-
56
-
57
-
58
-
59
-
60
-
61
-
62
-
63
-
64
-
65
-
66
-
67
-
68
-
69
-
70
-
71
-
72
-
73
-
74
-
75
-
76
-
77
-
78
-
79
-
80
-
81
-
82
-
83
-
84
-
85
-
86
-
87
-
88
-
89
-
90
-
91
-
92
-
93
-
94
-
95
-
96
-
97
-
98
-
99
-
100
-
101
-
102
-
103
-
104
-
105
-
106
-
107
-
108
-
109
-
110
-
111
-
112
-
113
-
114
-
115
-
116
-
 117
117 -
 118
118 -
 119
119 -
 120
120 -
 121
121 -
 122
122 -
 123
123 -
 124
124 -
 125
125 -
 126
126 -
 127
127 -
 128
128 -
 129
129 -
 130
130 -
 131
131 -
 132
132 -
 133
133 -
 134
134 -
 135
135 -
 136
136 -
 137
137 -
138
-
139
-
140
-
141
-
142
-
143
-
144
-
145
-
146
-
147
-
148
-
149
-
150
-
151
-
152
-
153
-
154
-
155
-
156
-
157
-
158
-
159
 |
 |

eBay Inc.
NOTES TO CONSOLIDATED FINANCIAL STATEMENTS—(Continued)
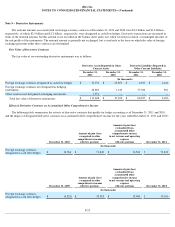
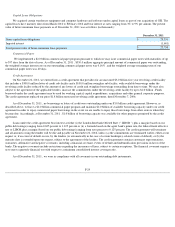
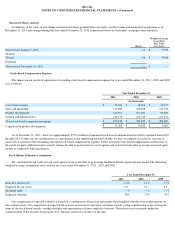
contribute up to 50% of their annual salary, but not more than statutory limits. In 2011 , 2010 and 2009 , we contributed one dollar for each dollar
a participant contributed, with a maximum contribution of 4% of each employee's salary, subject to a maximum employer contribution of $10,000
per employee for each period. Our non-U.S. employees are covered by various other savings plans. Our total expenses for these savings plans
were $50.2 million in 2011 , $47.4 million in 2010 and $42.8 million in 2009 .
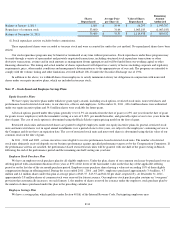
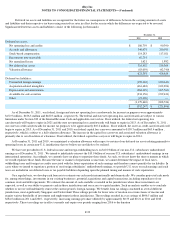
Deferred Stock Units
Since December 31, 2002, we have granted deferred stock units to non-employee directors (other than Pierre Omidyar) elected to our Board
of Directors with each new director receiving a one-time grant of deferred stock units equal to the result of dividing $150,000 by the fair market
value of our common stock on the date of grant. Beginning with our 2008 annual meeting of stockholders, we granted deferred stock units to each
non-employee director (other than Mr. Omidyar) at the time of our annual meeting of stockholders equal to the result of dividing $110,000 by the
fair market value of our common stock on the date of grant. Beginning with the 2011 annual meeting of stockholders, we granted deferred stock
units to each non-employee director (other than Mr. Omidyar) at the time of our annual meeting of stockholders equal to the result of dividing
$220,000 by the fair market value of our common stock on the date of grant. Each deferred stock unit constitutes an unfunded and unsecured
promise by us to deliver one share of our common stock (or the equivalent value thereof in cash or property at our election). Each deferred stock
unit award granted to a new non-employee director upon election to the Board vests 25% one year from the date of grant, and at a rate of 2.08%
per month thereafter. If the services of the director are terminated at any time, all rights to the unvested deferred stock units will also terminate. In
addition, directors may elect to receive, in lieu of annual retainer and committee chair fees and at the time these fees would otherwise be payable
(i.e., on a quarterly basis in arrears for services provided), fully vested deferred stock units with an initial value equal to the amount based on the
fair market value of common stock at the date of grant. Deferred stock units are payable following the termination of a director's tenure as a
director. As of December 31, 2011 , there were approximately 271,409 deferred stock units outstanding included in our restricted stock unit
activity below.
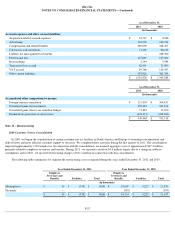
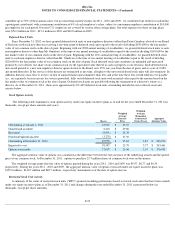
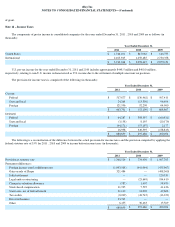
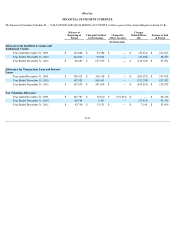
Stock Option Activity
The following table summarizes stock option activity under our equity incentive plans as of and for the year ended December 31, 2011 (in
thousands, except per share amounts and years):
The aggregate intrinsic value of options was calculated as the difference between the exercise price of the underlying awards and the quoted
price of our common stock. At December 31, 2011 , options to purchase 23.7 million shares of common stock were in-the-money.
The weighted average grant-date fair value of options granted during the years 2011 , 2010 and 2009 was $9.87 , $6.77 and $4.59 ,
respectively. During the years 2011 , 2010 and 2009 , the aggregate intrinsic value of options exercised under our equity incentive plans was
$129.0 million , $140.7 million and $69.7 million , respectively, determined as of the date of option exercise.
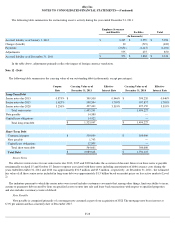
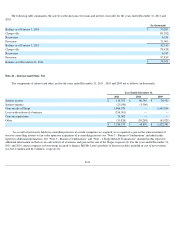
Restricted Stock Unit Activity
A summary of the status of restricted stock units ("RSU") granted (including performance-
based restricted stock units that have been earned)
under our equity incentive plans as of December 31, 2011 and changes during the year ended December 31, 2011 is presented below (in
thousands, except per share amounts):
F-35
Shares
Weighted
Average
Exercise
Price
Weighted
Average
Remaining
Contractual
Term (Years)
Aggregate
Intrinsic Value
Outstanding at January 1, 2011
43,907
$
23.67
Granted and assumed
8,418
$
29.66
Exercised
(8,991
)
$
18.20
Forfeited/expired/canceled
(3,278
)
$
27.50
Outstanding at December 31, 2011
40,056
$
25.84
3.85
$
249,290
Expected to vest
38,587
$
25.78
3.77
$
243,461
Options exercisable
27,098
$
25.96
2.95
$
176,053