WeightWatchers 2006 Annual Report Download - page 94
Download and view the complete annual report
Please find page 94 of the 2006 WeightWatchers annual report below. You can navigate through the pages in the report by either clicking on the pages listed below, or by using the keyword search tool below to find specific information within the annual report.-
 1
1 -
2
-
3
-
4
-
5
-
6
-
7
-
8
-
9
-
10
-
11
-
12
-
13
-
14
-
15
-
16
-
17
-
18
-
19
-
20
-
21
-
22
-
23
-
24
-
25
-
26
-
27
-
28
-
29
-
30
-
31
-
32
-
33
-
34
-
35
-
36
-
37
-
38
-
39
-
40
-
41
-
42
-
43
-
44
-
45
-
46
-
47
-
48
-
49
-
50
-
51
-
52
-
53
-
54
-
55
-
56
-
57
-
58
-
59
-
60
-
61
-
62
-
63
-
64
-
65
-
66
-
67
-
68
-
69
-
70
-
71
-
72
-
73
-
74
-
75
-
76
-
77
-
78
-
79
-
80
-
81
-
82
-
83
-
 84
84 -
 85
85 -
 86
86 -
 87
87 -
 88
88 -
 89
89 -
 90
90 -
 91
91 -
 92
92 -
 93
93 -
 94
94 -
 95
95 -
 96
96 -
 97
97 -
 98
98 -
 99
99 -
 100
100 -
 101
101 -
 102
102 -
 103
103 -
 104
104 -
105
-
106
-
107
-
108
-
109
-
110
-
111
-
112
 |
 |

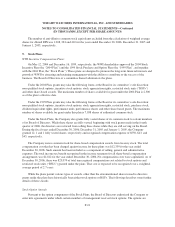
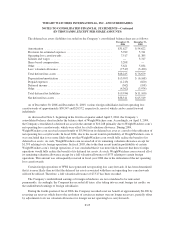
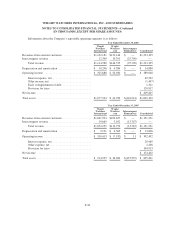
WEIGHT WATCHERS INTERNATIONAL, INC. AND SUBSIDIARIES
NOTES TO CONSOLIDATED FINANCIAL STATEMENTS—Continued
(IN THOUSANDS, EXCEPT PER SHARE AMOUNTS)
Year Ended January 1, 2005
Weight
Watchers
International
Weight
Watchers
.com
Intercompany
Eliminations Consolidated
Revenues from external customers ..................... $959,930 $64,989 $ — $1,024,919
Intercompany revenue .............................. 6,205 1,678 (7,883) —
Total revenue ................................. $966,135 $66,667 (7,883) $1,024,919
Depreciation and amortization ........................ $ 8,095 $ 2,148 $ — $ 10,243
Operating income .................................. $289,917 $16,011 $ (43) $ 305,885
Interest expense, net ............................ 16,759
Other income, net .............................. (4,685)
Early extinguishment of debt ..................... 4,264
Provision for taxes ............................. 94,522
Income before cumulative effect of accounting change ..... $ 195,025
Total assets ....................................... $796,231 $30,793 $(10,838) $ 816,186
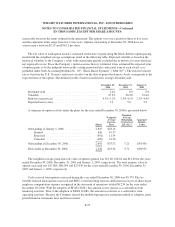
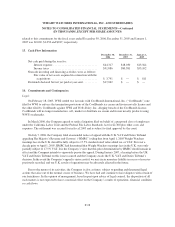
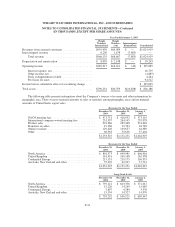
The following table presents information about the Company’s sources of revenue and other information by
geographic area. There were no material amounts of sales or transfers among geographic areas and no material
amounts of United States export sales.
Revenues for the Year Ended
December 30,
2006
December 31,
2005
January 1,
2005
NACO meeting fees .............................. $ 471,751 $ 416,952 $ 373,119
International company-owned meeting fees ........... 251,337 264,145 255,978
Product sales ................................... 293,286 285,448 274,640
Franchise royalties ............................... 19,168 19,393 18,789
Online revenues ................................. 129,420 109,657 64,989
Other ......................................... 68,363 55,656 37,404
$1,233,325 $1,151,251 $1,024,919
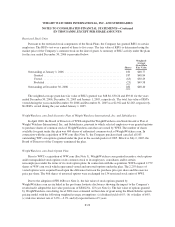
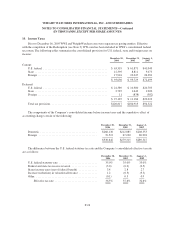
Revenues for the Year Ended
December 30,
2006
December 31,
2005
January 1,
2005
North America .................................. $ 801,373 $ 699,981 $ 606,916
United Kingdom ................................. 161,431 169,168 163,338
Continental Europe .............................. 215,151 219,175 196,953
Australia, New Zealand and other ................... 55,370 62,927 57,712
$1,233,325 $1,151,251 $1,024,919
Long-Lived Assets
December 30,
2006
December 31,
2005
January 1,
2005
North America .................................. $ 759,221 $ 603,356 $ 572,012
United Kingdom ................................. 15,220 14,249 15,089
Continental Europe .............................. 5,697 4,589 3,376
Australia, New Zealand and other ................... 15,154 14,327 14,970
$ 795,292 $ 636,521 $ 605,447
F-31