WeightWatchers 2006 Annual Report Download - page 47
Download and view the complete annual report
Please find page 47 of the 2006 WeightWatchers annual report below. You can navigate through the pages in the report by either clicking on the pages listed below, or by using the keyword search tool below to find specific information within the annual report.-
 1
1 -
2
-
3
-
4
-
5
-
6
-
7
-
8
-
9
-
10
-
11
-
12
-
13
-
14
-
15
-
16
-
17
-
18
-
19
-
20
-
21
-
22
-
23
-
24
-
25
-
26
-
27
-
28
-
29
-
30
-
31
-
32
-
33
-
34
-
35
-
36
-
 37
37 -
 38
38 -
 39
39 -
 40
40 -
 41
41 -
 42
42 -
 43
43 -
 44
44 -
 45
45 -
 46
46 -
 47
47 -
 48
48 -
 49
49 -
 50
50 -
 51
51 -
 52
52 -
 53
53 -
 54
54 -
 55
55 -
 56
56 -
 57
57 -
58
-
59
-
60
-
61
-
62
-
63
-
64
-
65
-
66
-
67
-
68
-
69
-
70
-
71
-
72
-
73
-
74
-
75
-
76
-
77
-
78
-
79
-
80
-
81
-
82
-
83
-
84
-
85
-
86
-
87
-
88
-
89
-
90
-
91
-
92
-
93
-
94
-
95
-
96
-
97
-
98
-
99
-
100
-
101
-
102
-
103
-
104
-
105
-
106
-
107
-
108
-
109
-
110
-
111
-
112
 |
 |

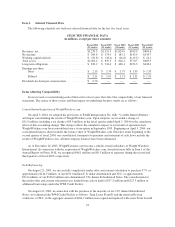
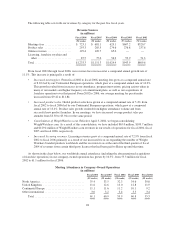
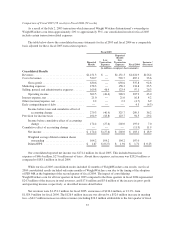
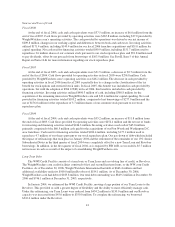
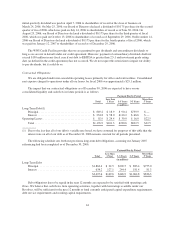
Comparison of Fiscal 2006 (52 weeks) to Fiscal 2005 (52 weeks)
The table below shows the consolidated income statements for the years ended December 30, 2006 and
December 31, 2005. As a result of the July 2, 2005 transaction, which increased Weight Watchers International’s
ownership in WeightWatchers.com from approximately 20% to approximately 53%, our consolidated results for
fiscal 2005 included certain transaction-related expenses in the amount of $46.4 million, as further explained in
Note 3 to the Consolidated Financial Statements. The table below shows the consolidated income statements for
fiscal 2006 and fiscal 2005 on a comparable basis adjusted for these fiscal 2005 transaction expenses.
Fiscal 2005
Fiscal 2006
Reported
Results
Less
Transaction
Expenses
Reported
Results
Less
Transaction
Expenses
Increase /
(Decrease)
(in millions, except per share amounts)
Revenues ................................... $1,233.3 $1,151.3 $ — $1,151.3 $82.0
Cost of revenues ............................. 557.1 520.7 — 520.7 36.4
Gross profit ............................. 676.2 630.6 — 630.6 45.6
Marketing expenses .......................... 158.9 158.3 — 158.3 0.6
Selling, general and administrative expenses ....... 137.3 169.8 46.4 123.4 13.9
Operating income .................... 380.0 302.5 (46.4) 348.9 31.1
Interest expense, net .......................... 49.5 21.0 — 21.0 28.5
Other (income)/expense, net .................... (1.4) 2.2 — 2.2 (3.6)
Early extinguishment of debt ................... 1.3 — — — 1.3
Income before taxes ...................... 330.6 279.3 (46.4) 325.7 4.9
Provision for income taxes ..................... 120.8 104.9 (18.8) 123.7 (2.9)
Net income ............................. $ 209.8 $ 174.4 $ (27.6) $ 202.0 $ 7.8
Weighted average diluted common shares
outstanding ........................... 99.4 104.2 104.2 104.2
Diluted EPS ............................ $ 2.11 $ 1.67 $ (0.27) $ 1.94 $0.17
As the table shows, our reported net income was $209.8 million for fiscal 2006, an increase of $35.4 million
from $174.4 million for fiscal 2005. Our net income for the year ended December 30, 2006 included $9.4 million
of incremental expense related to non-cash share-based compensation, partially as a result of our January 2006
adoption of FAS 123(R), and a $6.3 million net benefit from the reversal of income tax reserves and an
adjustment to a valuation allowance. Net income for fiscal 2006 of $209.8 million, including these items,
increased $7.8 million or 3.9% from $202.0 million in fiscal 2005, adjusted for the above transaction expenses.
Net revenues were $1,233.3 million for the year ended December 30, 2006, an increase of $82.0 million or
7.1%, from $1,151.3 million for fiscal 2005. The revenue increase of $82.0 million was driven by a $42.0 million
increase in meeting fees, a $19.7 million increase in online revenues, a $10.5 million increase in licensing
revenues, a $7.9 million increase in product sales and a $1.9 million increase in other revenues.
For fiscal 2006, total meeting fees were $723.1 million, versus $681.1 million for the same period in the
prior fiscal year, an increase of $42.0 million or 6.2% including the negative impact of foreign currency
translation. While attendance volumes in the period increased in NACO compared to the prior year period, these
gains were mostly offset by declines in attendance in the UK and Continental Europe, resulting in a 0.2%
increase in total worldwide attendance to 61.1 million, from 60.9 million in the prior year.
In NACO, meeting fees for fiscal 2006 were $471.8 million, up $54.8 million or 13.1%, from $417.0
million for fiscal 2005. Attendances grew 5.7% versus the prior year period to 35.4 million including the impact
34