WeightWatchers 2006 Annual Report Download - page 111
Download and view the complete annual report
Please find page 111 of the 2006 WeightWatchers annual report below. You can navigate through the pages in the report by either clicking on the pages listed below, or by using the keyword search tool below to find specific information within the annual report.-
 1
1 -
2
-
3
-
4
-
5
-
6
-
7
-
8
-
9
-
10
-
11
-
12
-
13
-
14
-
15
-
16
-
17
-
18
-
19
-
20
-
21
-
22
-
23
-
24
-
25
-
26
-
27
-
28
-
29
-
30
-
31
-
32
-
33
-
34
-
35
-
36
-
37
-
38
-
39
-
40
-
41
-
42
-
43
-
44
-
45
-
46
-
47
-
48
-
49
-
50
-
51
-
52
-
53
-
54
-
55
-
56
-
57
-
58
-
59
-
60
-
61
-
62
-
63
-
64
-
65
-
66
-
67
-
68
-
69
-
70
-
71
-
72
-
73
-
74
-
75
-
76
-
77
-
78
-
79
-
80
-
81
-
82
-
83
-
84
-
85
-
86
-
87
-
88
-
89
-
90
-
91
-
92
-
93
-
94
-
95
-
96
-
97
-
98
-
99
-
100
-
 101
101 -
 102
102 -
 103
103 -
 104
104 -
 105
105 -
 106
106 -
 107
107 -
 108
108 -
 109
109 -
 110
110 -
 111
111 -
 112
112
 |
 |

On December 31, 2006, I succeeded Linda A. Huett
as Weight Watchers International’s President and Chief
Executive Offi cer. During her 23 years with the company, including sev-
en as President and CEO, Linda oversaw the transformation of Weight
Watchers into a diverse enterprise with multiple revenue streams and
growth drivers. Today, Weight Watchers is a robust and growing orga-
nization with an exceptional global brand, industry-leading services and
products and an enormously dedicated and talented group of employ-
ees and service providers. It is an honor for me to have the opportunity
to lead this company and to be a part of the critical mission it serves in
helping to address the global obesity epidemic.
Weight Watchers has never been in a better position to tackle the
issue of obesity. With the number of overweight and obese people
steadily increasing over the past 20 years to a now estimated 1.6 bil-
lion, it is no wonder that people across the globe continue to search
for help in achieving their weight loss goals. More than ever, there
is a critical need for our services and products. At the center of
our enduring success is our unique approach that combines long-
$0.00
$50.00
$100.00
$150.00
$200.00
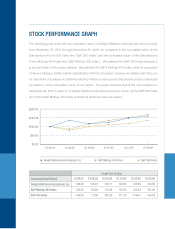
12.29.01 12.28.02 01.03.04 01.01.05 12.31.05 12.30.06
12.29.01
100.00
100.00
100.00
12.28.02
135.78
85.49
77.90
01.03.04
116.71
115.94
100.25
Fiscal Year Ending
Company/Index/Market
Weight Watchers International, Inc.
S&P MidCap 400 Index
S&P 500 Index
01.01.05
122.96
135.05
111.15
12.31.05
147.99
152.00
116.61
12.30.06
159.65
167.69
135.03
Weight Watchers International, Inc. S&P 500 IndexS&P MidCap 400 Index
STOCK PERFORMANCE GRAPH
The following graph sets forth the cumulative return on Weight Watchers International common stock
from December 29, 2001 through December 30, 2006, as compared to the cumulative return of the
Standard and Poor’s 500 Index (the “S&P 500 Index”) and the cumulative return of the Standard and
Poor’s MidCap 400 Index (the “S&P MidCap 400 Index”). We selected the S&P 500 Index because it
is a broad index of the equity markets. We selected the S&P’s MidCap 400 Index, which is comprised
of issuers having a similar market capitalization with the Company, because we believe that there are
no other lines of business or published industry indices or peer groups that provide a more meaningful
comparison of the cumulative return of our stock. The graph assumes that $100 was invested on
December 29, 2001 in each of (1) Weight Watchers International common stock, (2) the S&P 500 Index
and (3) the S&P MidCap 400 Index and that all dividends were reinvested.