WeightWatchers 2006 Annual Report Download - page 41
Download and view the complete annual report
Please find page 41 of the 2006 WeightWatchers annual report below. You can navigate through the pages in the report by either clicking on the pages listed below, or by using the keyword search tool below to find specific information within the annual report.-
 1
1 -
2
-
3
-
4
-
5
-
6
-
7
-
8
-
9
-
10
-
11
-
12
-
13
-
14
-
15
-
16
-
17
-
18
-
19
-
20
-
21
-
22
-
23
-
24
-
25
-
26
-
27
-
28
-
29
-
30
-
 31
31 -
 32
32 -
 33
33 -
 34
34 -
 35
35 -
 36
36 -
 37
37 -
 38
38 -
 39
39 -
 40
40 -
 41
41 -
 42
42 -
 43
43 -
 44
44 -
 45
45 -
 46
46 -
 47
47 -
 48
48 -
 49
49 -
 50
50 -
 51
51 -
52
-
53
-
54
-
55
-
56
-
57
-
58
-
59
-
60
-
61
-
62
-
63
-
64
-
65
-
66
-
67
-
68
-
69
-
70
-
71
-
72
-
73
-
74
-
75
-
76
-
77
-
78
-
79
-
80
-
81
-
82
-
83
-
84
-
85
-
86
-
87
-
88
-
89
-
90
-
91
-
92
-
93
-
94
-
95
-
96
-
97
-
98
-
99
-
100
-
101
-
102
-
103
-
104
-
105
-
106
-
107
-
108
-
109
-
110
-
111
-
112
 |
 |

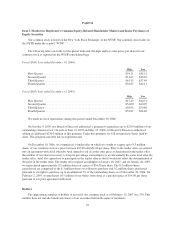
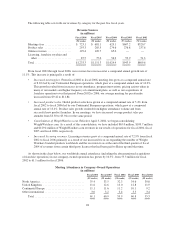
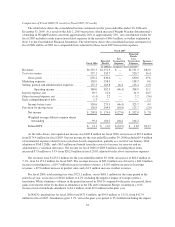
The following table sets forth our revenues by category for the past five fiscal years.
Revenue Sources
(in millions)
Fiscal 2006 Fiscal 2005 Fiscal 2004 Fiscal 2003 Fiscal 2002
(52 weeks) (52 weeks) (52 weeks) (53 weeks) (52 weeks)
Meetings fees ................... $ 723.1 $ 681.1 629.1 $607.2 $520.7
Product sales ................... 293.3 285.5 274.6 276.8 237.6
Online revenues ................. 129.4 109.7 65.0 — —
Licensing, franchise royalties and
other ........................ 87.5 75.0 56.2 59.9 51.3
Total .......................... $1,233.3 $1,151.3 $1,024.9 $943.9 $809.6
From fiscal 2002 through fiscal 2006, our revenues have increased at a compound annual growth rate of
11.1%. This increase is principally a result of:
•Increased meeting fees. From fiscal 2002 to fiscal 2006, meeting fees grew at a compound annual rate
of 8.6% led by our Continental European operations, which grew at a compound annual rate of 14.2%.
This growth resulted from increases in our attendance, program innovations, pricing actions taken in
many of our markets and higher frequency of commitment plans, as well as our acquisitions of
franchise operations over that period. From 2002 to 2006, our average meeting fee per attendee
increased from $9.42 to $11.84.
•Increased product sales. Global product sales have grown at a compound annual rate of 5.4% from
fiscal 2002 to fiscal 2006 led by our Continental European operations, which grew at a compound
annual rate of 13.4%. Product sales growth resulted from higher attendance volume and from
successful new product launches. In our meetings, we have increased average product sales per
attendee from $3.30 to $3.94 over the same period.
•Consolidation of WeightWatchers.com. Effective April 3, 2004, we began consolidating
WeightWatchers.com. As a result of this consolidation, we have included $65.0 million, $109.7 million
and $129.4 million of WeightWatchers.com revenues in our results of operations for fiscal 2004, fiscal
2005 and fiscal 2006, respectively.
•Increased licensing revenues. Licensing revenues grew at a compound annual rate of 72.9% from fiscal
2002 to fiscal 2006 primarily as a result of our increased focus on expanding the number of Weight
Watchers branded products worldwide and the reversion to us at the end of the third quarter of fiscal
2004 of revenues from certain third party licenses that had been paid to Heinz up until that time.
As shown in the chart below, our worldwide annual attendance (including the aforementioned acquisitions
of franchise operations) in our company-owned operations has grown by 10.5%, from 55.3 million for fiscal
2002 to 61.1 million for fiscal 2006.
Meeting Attendance in Company-Owned Operations
(in millions)
Fiscal 2006 Fiscal 2005 Fiscal 2004 Fiscal 2003 Fiscal 2002
(52 weeks) (52 weeks) (52 weeks) (53 weeks) (52 weeks)
North America ............................... 35.4 33.5 32.3 34.6 30.8
United Kingdom ............................. 11.6 12.6 13.0 12.8 11.9
Continental Europe ........................... 11.1 11.6 11.2 10.1 9.2
Other international ............................ 3.0 3.2 3.4 3.3 3.4
Total ................................... 61.1 60.9 59.9 60.8 55.3
28